HOT TOPICS LIST
- MACD
- Fibonacci
- RSI
- Gann
- ADXR
- Stochastics
- Volume
- Triangles
- Futures
- Cycles
- Volatility
- ZIGZAG
- MESA
- Retracement
- Aroon
INDICATORS LIST
LIST OF TOPICS
PRINT THIS ARTICLE
by Donald W. Pendergast, Jr.
Down by more than 21% in the past two months, shares of Occidental Petroleum Corp. may be getting into a historically oversold zone.
Position: N/A
Donald W. Pendergast, Jr.
Freelance financial markets writer and online publisher of the Trendzetterz.com S&P 500 Weekly Forecast service.
PRINT THIS ARTICLE
CYCLES
OXY Getting Too Oversold?
11/19/12 10:08:49 AMby Donald W. Pendergast, Jr.
Down by more than 21% in the past two months, shares of Occidental Petroleum Corp. may be getting into a historically oversold zone.
Position: N/A
| Occidental Petroleum Corp. (OXY) is a fairly good swing and/or trend-following instrument, depending on how skilled those who trade it actually are. Those who possess these trading assets are likely to do well with this (or any other) large-cap stock capable of sustainable swing and trending moves: 1. A reliable mechanical trading system to generate buy/sell signals 2. An intelligent way to either scale in or scale out of winning trades 3. An emotion-free, automatic way to cut losses short with initial and/or trailing stops 4. The ability to analyze the broad market to locate the sectors and industry groups that are under - or outperforming key stock indexes like the .SPX and .RUT. Many of those reading this may be deficient in at least one (if not more) of those particular trading disciplines, and if you are one of those traders/investors, then you need to reevaluate your overall trading plan (you do have a definite, written-out trading plan, right?) to help bring all of these important pieces of the trading puzzle back into order before putting on another trade. For those who do that, the upcoming major cycle low in OXY could prove to be a profitable and rewarding trade. Here's a closer look at just why this is, right now. |

|
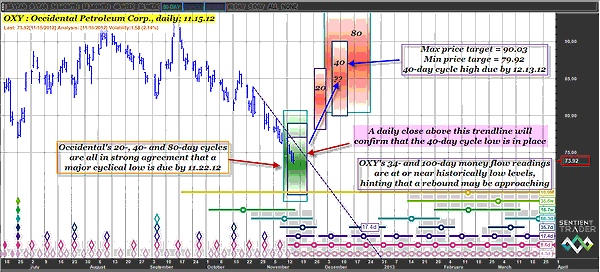
| FIGURE 1: OXY, DAILY. OXY is just one among dozens of large-cap energy sector stocks making similar chart patterns. The probabilities of a sharp short-covering rally in this sector grow exponentially with each passing day. |
| Graphic provided by: Sentient Trader. |
| |
| OXY's 34- and 100-day Chaikin money flow [(CMF) (34) and (CMF) (100)] histograms are now at such negatively overextended levels that it will not be surprising to see the smart money interests in the market begin to establish progressively larger positions in this key oil sector stock. They may also be aware of the fact that OXY's 20-, 40-, and 80-day price cycles are all on target to bottom simultaneously between now and November 22, 2012, and that dozens of other large-cap integrated oil/oil exploration & production/oil services stocks are also well along in the process of forming major multicycle lows. They are also no doubt aware that the .SPX, .NDX, and .RUT are also approaching low-risk buy zones within the next week and that a tradable marketwide rally can erupt at virtually any time within the next seven to 10 days. See Figure 1. Here's how to play this anticipated reversal in OXY, using a dirt-simple trading system/plan that can capitalize on a near-term capitulation in the stock. |

|
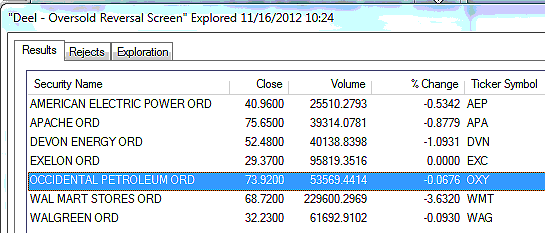
| FIGURE 2: DEEL OVERSOLD. The S&P 100 components that the Deel Oversold Reversal Screen has identified as being potential bullish reversal candidates as of Thursday, November 15, 2012. |
| Graphic provided by: MetaStock. |
| Graphic provided by: Deel Oversold Reversal Screen from MetaStock 11. |
| |
| First of all, wait for OXY to make a daily close above the downtrend line on the chart. This daily close needs to be completed no later than November 23, 2012. This will be your initial confirmation that OXY intends to run higher in the days ahead (because it will have provided confirmation that OXY's 40-day cycle low is already in place) and will serve as your trigger bar. If OXY breaks above that trigger bar high at any time within the next two to three sessions, look to sell December '12 OXY $67.50 put options, risking no more than 2% of your margin account's net worth. These options have a small delta of only (0.2239) and a daily time decay factor of more than $3 per contract/per day. See Figure 2. The big idea here is not to hold on and hope OXY will rocket higher into any one of the red time/price projection boxes on the chart but rather to capitalize on the rapid time decay of the puts (options lose time value at an ever-increasing rate during the last 30 days of their life) even as the stock moves more out-of-the-money, significantly above the strike price of $67.50. Trade management is simple; if the puts decline in value by half or enter the lower portion of the first red box (near 78.00) buy at least half the number of short puts back and then start running a three-bar trailing stop of OXY's daily lows for the rest of the trade's life, a daily close below that trail means you buy the rest of the position back, no questions asked. Conversely, if the trade doesn't work out as planned and OXY stumbles and falls, buy the puts back at a loss if the stock makes a daily close below 72.43. If this happens, the loss on the trade should be minor, and given the high probability of success for this trade setup, its risk-to-reward ratio is excellent. Again, don't get carried away and try to sell every OXY December $67.50 put you can get your hands on but rather take a risk commensurate to the size of your margin account, never risking more than 2% on this or any other stock or option trade. While this trading system and plan is simple indeed, you can see that it easily meets the qualifications of points 1-3 mentioned earlier, and with the broad markets and most large-cap oil sector stocks all ready to bottom and reverse higher into late November 2012, perhaps we've done a good job of making sure that the qualifications for point 4 have also been met, too. More aggressive traders can elect to use the December $70.00 puts, using the same basic trading plan. Trade wisely until we meet here again. |
Freelance financial markets writer and online publisher of the Trendzetterz.com S&P 500 Weekly Forecast service.
| Title: | Market consultant and writer |
| Company: | Trendzetterz |
| Address: | 81 Hickory Hollow Drive |
| Crossville, TN 38555 | |
| Phone # for sales: | 904-303-4814 |
| Website: | trendzetterz.com |
| E-mail address: | support@trendzetterz.com |
Traders' Resource Links | |
| Trendzetterz has not added any product or service information to TRADERS' RESOURCE. | |
Click here for more information about our publications!
PRINT THIS ARTICLE

|

Request Information From Our Sponsors
- StockCharts.com, Inc.
- Candle Patterns
- Candlestick Charting Explained
- Intermarket Technical Analysis
- John Murphy on Chart Analysis
- John Murphy's Chart Pattern Recognition
- John Murphy's Market Message
- MurphyExplainsMarketAnalysis-Intermarket Analysis
- MurphyExplainsMarketAnalysis-Visual Analysis
- StockCharts.com
- Technical Analysis of the Financial Markets
- The Visual Investor
- VectorVest, Inc.
- Executive Premier Workshop
- One-Day Options Course
- OptionsPro
- Retirement Income Workshop
- Sure-Fire Trading Systems (VectorVest, Inc.)
- Trading as a Business Workshop
- VectorVest 7 EOD
- VectorVest 7 RealTime/IntraDay
- VectorVest AutoTester
- VectorVest Educational Services
- VectorVest OnLine
- VectorVest Options Analyzer
- VectorVest ProGraphics v6.0
- VectorVest ProTrader 7
- VectorVest RealTime Derby Tool
- VectorVest Simulator
- VectorVest Variator
- VectorVest Watchdog
