HOT TOPICS LIST
- MACD
- Fibonacci
- RSI
- Gann
- ADXR
- Stochastics
- Volume
- Triangles
- Futures
- Cycles
- Volatility
- ZIGZAG
- MESA
- Retracement
- Aroon
INDICATORS LIST
LIST OF TOPICS
PRINT THIS ARTICLE
by Matt Blackman
These previous market darlings pulled the market higher in good times. But now they are doing the opposite.
Position: Sell
Matt Blackman
Matt Blackman is a full-time technical and financial writer and trader. He produces corporate and financial newsletters, and assists clients in getting published in the mainstream media. He is the host of TradeSystemGuru.com. Matt has earned the Chartered Market Technician (CMT) designation. Find out what stocks and futures Matt is watching on Twitter at www.twitter.com/RatioTrade
PRINT THIS ARTICLE
VOLUME INDICATOR
Market Leaders Tell A Tale Of Woe
11/19/12 10:29:27 AMby Matt Blackman
These previous market darlings pulled the market higher in good times. But now they are doing the opposite.
Position: Sell
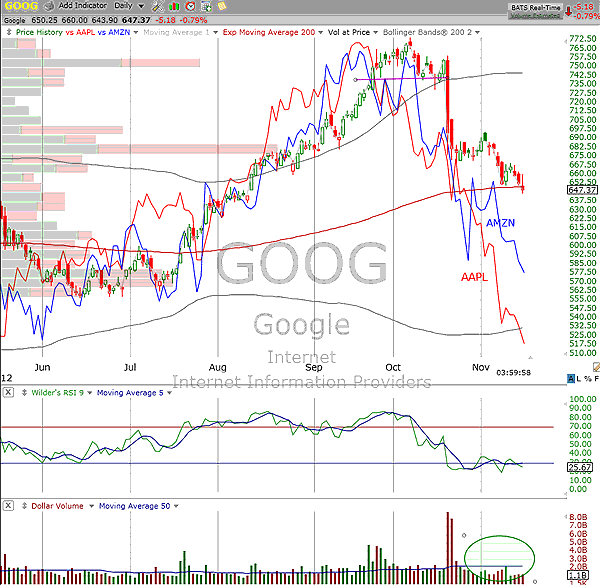
| Since peaking in early October, stocks have struggled. First it was due in large part to the uncertainty over who would rule the roost in Washington. Once that question was settled on November 7, uncertainty turned to worry over the approaching fiscal cliff that had the potential to drive taxes up and spending down by as much as $600 billion next year if current tax and spending policies, set to expire, actually do. As we see in Figure 1, we compare the performance of market leaders Google (GOOG), Apple (AAPL), and Amazon (AMZN) over the last month or so since all peaked within weeks of each other. As of the second week in November, there were few if any signs of a bottoming process in place. Volumes and volatility remained low, overall market breadth was abysmal, and the put/call ratio showed little signs of peaking, which often accompanies a bottom. |

|
| FIGURE 1: GOOG, DAILY. Note that GOOG volume had remained low as the stock ground lower with few if any signs of capitulation that often accompany a bottom. |
| Graphic provided by: TC2000.com. |
| |
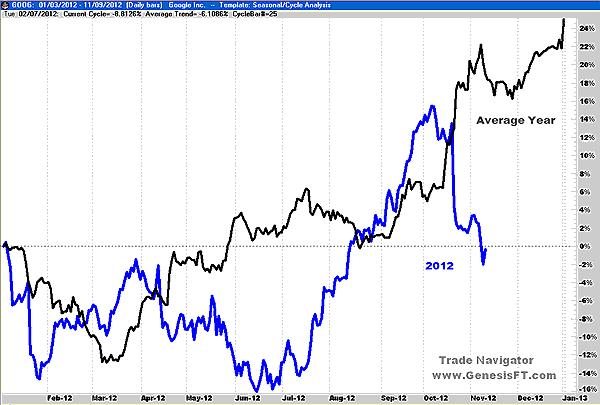
| In Figure 2, we see a comparison of GOOG stock performance for 2012 versus average annual performance since the stock's initial public offering in 2004. Given the current trajectory, 2012 will be the second worst year for the stock since its nearly 60% drop in 2008, in the process making 2012 only the third calendar year in which the stock lost money. |

|
| FIGURE 2: GOOG, ANNUALLY. The annual cycle chart of GOOG showing the performance in 2012 versus average annual performance since 2004. |
| Graphic provided by: Trade Navigator www.GenesisFT.com. |
| |
| Annual performance charts also provide value in showing seasonal periods of strength and weakness. For example, in Figure 2, we see that GOOG has typically experienced a period of weakness in the first nine weeks of the year, followed by a period of strength into mid-July, more weakness until September, and then putting in all its average annual gains into the year-end. |
| In other words, autumn has typically been the best time of the year to be invested in GOOG, but that trend is clearly in danger of not happening this year! |
Matt Blackman is a full-time technical and financial writer and trader. He produces corporate and financial newsletters, and assists clients in getting published in the mainstream media. He is the host of TradeSystemGuru.com. Matt has earned the Chartered Market Technician (CMT) designation. Find out what stocks and futures Matt is watching on Twitter at www.twitter.com/RatioTrade
| Company: | TradeSystemGuru.com |
| Address: | Box 2589 |
| Garibaldi Highlands, BC Canada | |
| Phone # for sales: | 604-898-9069 |
| Fax: | 604-898-9069 |
| Website: | www.tradesystemguru.com |
| E-mail address: | indextradermb@gmail.com |
Traders' Resource Links | |
| TradeSystemGuru.com has not added any product or service information to TRADERS' RESOURCE. | |
Click here for more information about our publications!
Comments

|

Request Information From Our Sponsors
- StockCharts.com, Inc.
- Candle Patterns
- Candlestick Charting Explained
- Intermarket Technical Analysis
- John Murphy on Chart Analysis
- John Murphy's Chart Pattern Recognition
- John Murphy's Market Message
- MurphyExplainsMarketAnalysis-Intermarket Analysis
- MurphyExplainsMarketAnalysis-Visual Analysis
- StockCharts.com
- Technical Analysis of the Financial Markets
- The Visual Investor
- VectorVest, Inc.
- Executive Premier Workshop
- One-Day Options Course
- OptionsPro
- Retirement Income Workshop
- Sure-Fire Trading Systems (VectorVest, Inc.)
- Trading as a Business Workshop
- VectorVest 7 EOD
- VectorVest 7 RealTime/IntraDay
- VectorVest AutoTester
- VectorVest Educational Services
- VectorVest OnLine
- VectorVest Options Analyzer
- VectorVest ProGraphics v6.0
- VectorVest ProTrader 7
- VectorVest RealTime Derby Tool
- VectorVest Simulator
- VectorVest Variator
- VectorVest Watchdog
