HOT TOPICS LIST
- MACD
- Fibonacci
- RSI
- Gann
- ADXR
- Stochastics
- Volume
- Triangles
- Futures
- Cycles
- Volatility
- ZIGZAG
- MESA
- Retracement
- Aroon
INDICATORS LIST
LIST OF TOPICS
PRINT THIS ARTICLE
by Koos van der Merwe
Vikram Pandit resigned abruptly last month as CEO of Citigroup. The bank paid him a bonus of $6.7 million for work he did for the bank this year.
Position: N/A
Koos van der Merwe
Has been a technical analyst since 1969, and has worked as a futures and options trader with First Financial Futures in Johannesburg, South Africa.
PRINT THIS ARTICLE
RECTANGLES
What's Cooking At Citigroup?
11/16/12 08:52:19 AMby Koos van der Merwe
Vikram Pandit resigned abruptly last month as CEO of Citigroup. The bank paid him a bonus of $6.7 million for work he did for the bank this year.
Position: N/A
| What's cooking at Citigroup? Vikram Pandit was a very convincing CEO whenever he was interviewed on television. But then he resigned, and the share price rose?! Is there something going on within the company, that shareholders do not know? Today, the rumor is that the company will split -- how true is that? Let us see what the charts are telling us. |

|
| FIGURE 1: C, WEEKLY |
| Graphic provided by: AdvancedGET. |
| |
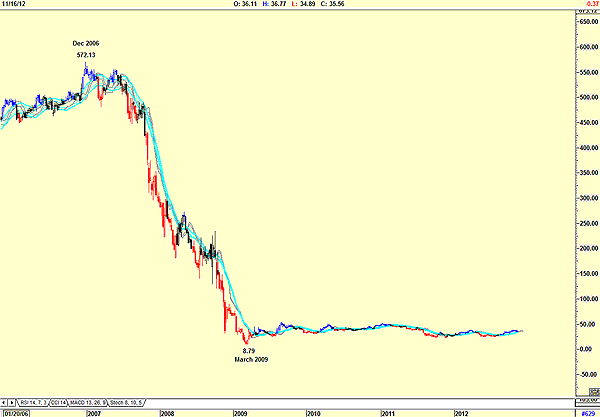
| Figure 1 is a weekly chart, showing how the share price has fallen from a high of $572.13 on December 2006 to a low of $8.79 by March 2009. The share price has dropped by $563.34 and the bank still exists? (We should not forget the 10:1 consolidation that occurred.) We all know about the mortgage-backed crises that caused many banks to look to the government for support, but for a bank to pay a CEO a bonus for a single year he led the bank? Well, there must be something I am missing, so let me look at the daily chart shown in Figure 2. |

|
| FIGURE 2: C, DAILY |
| Graphic provided by: AdvancedGET. |
| |
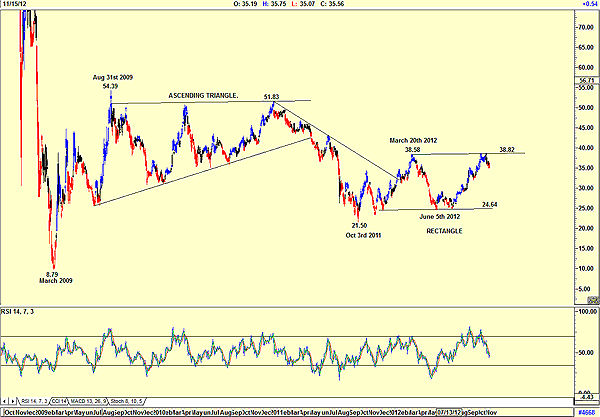
| Figure 2, a daily chart that shows how the share price has moved from the low of $8.79 in March 2009 to a high of $54.39 by August 31, 2009, moved sideways in what looks like an ascending triangle. An ascending triangle is a formation that develops when demand is rising yet continues to meet supply at a fixed price. Should that supply distributed at a price start drying up, then the share price will rise; however, should that supply not dry up, the share price will fall. The chart shows that the supply at $51.83 was greater than the demand, and the share price fell to a low of $21.50 by October 3, 2011. From that low, the share price rose to $38.52 by March 20, 2012, and has been moving in a rectangle. The width of a rectangle can be added to or subtracted from the point of breakout to give an approximate target. With the relative strength index (RSI) trending down, the likelihood of a retest of $24.64 is possible. Whether the share price will break below this point is a possibility that should not be discarded. Citigroup is in a state of flux at the moment. The indecision as to what will happen with the company is weighing on the share price movement. A move above $38.82 will see the share price target $53.00 (38.82 - 24.64 = 14.18 + 38.82 = 53.00). A move below $24.64 will see the price target $10.46 (24.64 - 14.18 = 10.46). I believe that this latter target is unlikely, but one never knows. |
Has been a technical analyst since 1969, and has worked as a futures and options trader with First Financial Futures in Johannesburg, South Africa.
| Address: | 3256 West 24th Ave |
| Vancouver, BC | |
| Phone # for sales: | 6042634214 |
| E-mail address: | petroosp@gmail.com |
Click here for more information about our publications!
Comments

|

Request Information From Our Sponsors
- VectorVest, Inc.
- Executive Premier Workshop
- One-Day Options Course
- OptionsPro
- Retirement Income Workshop
- Sure-Fire Trading Systems (VectorVest, Inc.)
- Trading as a Business Workshop
- VectorVest 7 EOD
- VectorVest 7 RealTime/IntraDay
- VectorVest AutoTester
- VectorVest Educational Services
- VectorVest OnLine
- VectorVest Options Analyzer
- VectorVest ProGraphics v6.0
- VectorVest ProTrader 7
- VectorVest RealTime Derby Tool
- VectorVest Simulator
- VectorVest Variator
- VectorVest Watchdog
- StockCharts.com, Inc.
- Candle Patterns
- Candlestick Charting Explained
- Intermarket Technical Analysis
- John Murphy on Chart Analysis
- John Murphy's Chart Pattern Recognition
- John Murphy's Market Message
- MurphyExplainsMarketAnalysis-Intermarket Analysis
- MurphyExplainsMarketAnalysis-Visual Analysis
- StockCharts.com
- Technical Analysis of the Financial Markets
- The Visual Investor
