
HOT TOPICS LIST
- MACD
- Fibonacci
- RSI
- Gann
- ADXR
- Stochastics
- Volume
- Triangles
- Futures
- Cycles
- Volatility
- ZIGZAG
- MESA
- Retracement
- Aroon
INDICATORS LIST
LIST OF TOPICS
PRINT THIS ARTICLE
by David Penn
Is the long-term bullish case for gold built on the back of the short-term bearish case?
Position: N/A
David Penn
Technical Writer for Technical Analysis of STOCKS & COMMODITIES magazine, Working-Money.com, and Traders.com Advantage.
PRINT THIS ARTICLE
GOLD & METALS
Gold Bugs, Corrections and Comebacks
07/19/02 09:20:42 AMby David Penn
Is the long-term bullish case for gold built on the back of the short-term bearish case?
Position: N/A
| "Silver and gold, silver and gold / Everyone wishes for silver and gold / How do you measure its worth? / Just by the pleasure it gives here on Earth..." So sang Burl Ives, the classic Christmas crooner, in "Rudolph the Red-Nosed Reindeer." But there's more to measuring the value of precious metals than the say so of Mr. Ives. Ever since breaking out above a downwardly sloping, mid-year consolidation in 2001 (arguably, a failed descending triangle), the AMEX Gold Bugs Index ($HUI or $HUI.X) has advanced 97% in a little over a month (see chart). This kind of explosively bullish move in gold stocks has not been common. Although the rally in late 2000/early 2001 was similarly sizable (114% from mid-November 2000 to late May 2001), one has to look back more than a few years to find gold stocks -- particularly the unhedged variety that make up the AMEX Gold Bugs Index -- making these kinds of advances. |
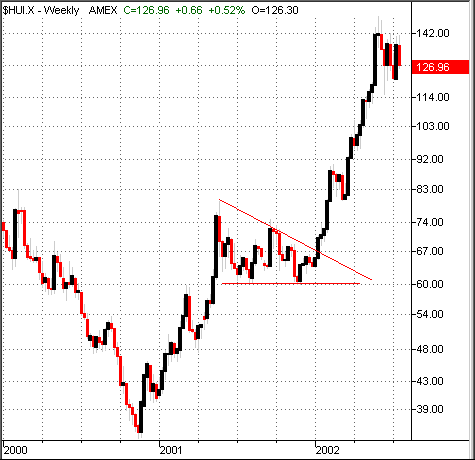 Figure 1: This failed descending triangle breakdown was good news for gold bugs. But those watching these advances need to begin thinking about reversals -- even if they are only temporary ones. Whether gold is moving upward or downward, the yellow metal is notorious for quick, furious moves. Recall that in 1999, gold prices shot up 27% in less than three weeks, before resuming the decline that led to the bottom in the spring of 2001. For those looking at the AMEX Gold Bugs Index and its components, the current consolidation that has seized the gold market in June and July should be the prime area of focus in terms of anticipating either a reversal or a full-fledged resumption of the bull market. |
|
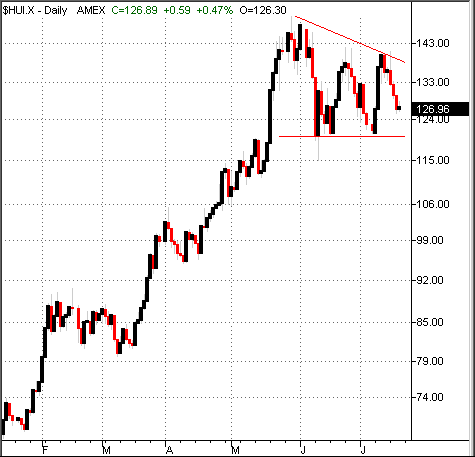
| Figure 2. Has the Gold Bugs Index topped out for the time being? Lower highs hint at difficulties ahead for any renewed advance. |
| Graphic provided by: MetaStock. |
| |
| The current top in $HUI is at least superficially similar to the mid-2001 consolidation mentioned above. Note in particular the descending triangle-like shape of the current top, with its horizontal support level at about 120 and the downwardly sloping resistance trendline connecting the June and July 2002 highs. The question, of course, is whether this "descending triangle top" will behave similarly to the "descending triangle top-turned-consolidation" from 2001. While there is little in the index itself to tell us which way the break will go (or whether the $HUI will simply consolidate trendlessly for another month or more), there may be some indication of where $HUI as a whole is headed by studying the charts of its, ahem, parts. |
| Unfortunately for the gold bugs, these parts appear due for a correction. Almost without exception (and the exceptions are not especially compelling), the components of the AMEX Gold Bugs Index are showing signs of tops, in either head and shoulders or triangle top guises. |
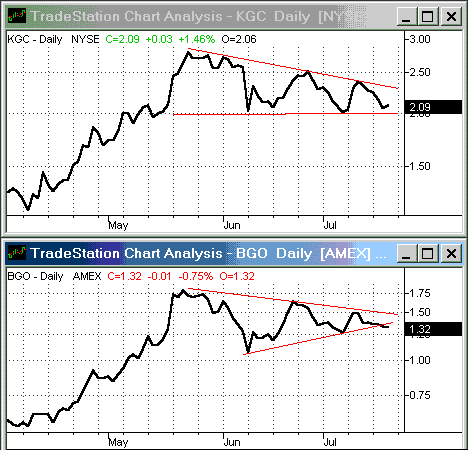 Figure 3. Kinross Gold (KGC) and Bema Gold (BGO) have triangle-shaped tops. 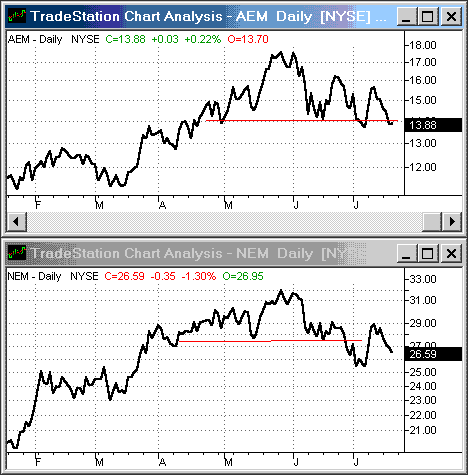 Figure 4. Newmont Mining and Agnico-Eagle Mines have head and shoulders-shaped tops. These four Gold Bugs Index components all seem to support the notion of a short-term correction for gold stocks, at least, again, among the non-hedgers. The emphasis is on "short-term," because none of the breakdowns from these triangle tops or head and shoulders tops alone look likely to prove fatal to these stocks ("fatal" meaning a new bear market). There are two $HUI components, Coeur d'Alene Mines (CDE) and Hecla Mining (HL), whose price action in the summer of 2002 is a bit more interesting -- if not contradicting the behavior of the other components. By this I mean that CDE and HL are showing some bullishness at the top -- particularly CDE, which is making new highs -- that may suggest either that near-term corrections for $HUI stocks will be brief or that there might not be much in the way of a near-term correction for these stocks, at all. 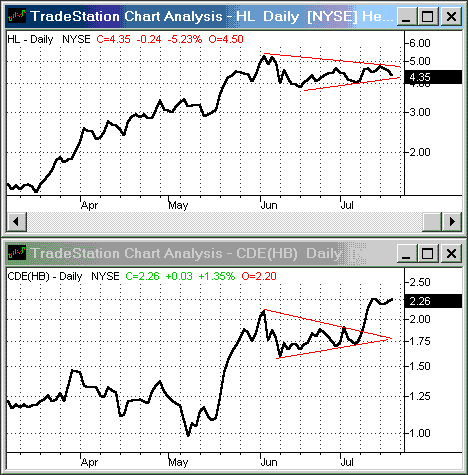 Figure 5. Some of the smaller components of the $HUI seem to be maintaining their tops better than their larger counterparts. |
Technical Writer for Technical Analysis of STOCKS & COMMODITIES magazine, Working-Money.com, and Traders.com Advantage.
| Title: | Technical Writer |
| Company: | Technical Analysis, Inc. |
| Address: | 4757 California Avenue SW |
| Seattle, WA 98116 | |
| Phone # for sales: | 206 938 0570 |
| Fax: | 206 938 1307 |
| Website: | www.Traders.com |
| E-mail address: | DPenn@traders.com |
Traders' Resource Links | |
| Charting the Stock Market: The Wyckoff Method -- Books | |
| Working-Money.com -- Online Trading Services | |
| Traders.com Advantage -- Online Trading Services | |
| Technical Analysis of Stocks & Commodities -- Publications and Newsletters | |
| Working Money, at Working-Money.com -- Publications and Newsletters | |
| Traders.com Advantage -- Publications and Newsletters | |
| Professional Traders Starter Kit -- Software | |
Click here for more information about our publications!
PRINT THIS ARTICLE

Request Information From Our Sponsors
- StockCharts.com, Inc.
- Candle Patterns
- Candlestick Charting Explained
- Intermarket Technical Analysis
- John Murphy on Chart Analysis
- John Murphy's Chart Pattern Recognition
- John Murphy's Market Message
- MurphyExplainsMarketAnalysis-Intermarket Analysis
- MurphyExplainsMarketAnalysis-Visual Analysis
- StockCharts.com
- Technical Analysis of the Financial Markets
- The Visual Investor
- VectorVest, Inc.
- Executive Premier Workshop
- One-Day Options Course
- OptionsPro
- Retirement Income Workshop
- Sure-Fire Trading Systems (VectorVest, Inc.)
- Trading as a Business Workshop
- VectorVest 7 EOD
- VectorVest 7 RealTime/IntraDay
- VectorVest AutoTester
- VectorVest Educational Services
- VectorVest OnLine
- VectorVest Options Analyzer
- VectorVest ProGraphics v6.0
- VectorVest ProTrader 7
- VectorVest RealTime Derby Tool
- VectorVest Simulator
- VectorVest Variator
- VectorVest Watchdog
