HOT TOPICS LIST
- MACD
- Fibonacci
- RSI
- Gann
- ADXR
- Stochastics
- Volume
- Triangles
- Futures
- Cycles
- Volatility
- ZIGZAG
- MESA
- Retracement
- Aroon
INDICATORS LIST
LIST OF TOPICS
PRINT THIS ARTICLE
by Donald W. Pendergast, Jr.
Now trading at a new 52-week low, shares of Apache Corp. may be approaching a significant bullish reversal zone.
Position: N/A
Donald W. Pendergast, Jr.
Freelance financial markets writer and online publisher of the Trendzetterz.com S&P 500 Weekly Forecast service.
PRINT THIS ARTICLE
CYCLES
Is Apache Corp. Preparing For A Reversal?
11/15/12 11:12:15 AMby Donald W. Pendergast, Jr.
Now trading at a new 52-week low, shares of Apache Corp. may be approaching a significant bullish reversal zone.
Position: N/A
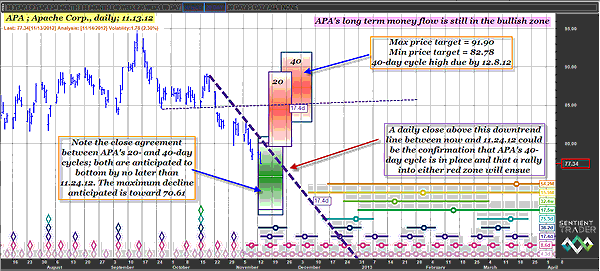
| Energy sector stocks always seem to be in a hurry to get someplace; they can be driven sharply higher or lower in a matter of days as their valuations are affected by geopolitical events, natural disasters, governmental policies, and the price of fossil fuels. As such, they can make excellent swing trading vehicles for skilled traders who possess a well-thought-out trading plan. Here's a look at one of the most volatile large-cap energy stocks as we analyze the daily cycles chart of Apache Corp. and its upcoming bullish trend reversal setup. (See Figure 1.) |

|
| FIGURE 1: APA, DAILY. The probabilities for a bullish trend reversal by late November 2012 are getting better every day. Note that the current downswing has already met its 100% continuation move price target. |
| Graphic provided by: Sentient Trader. |
| |
| APA made a major multicycle low in early June 2012 (as seven cycles ranging from four days to 32 weeks in length bottomed simultaneously), but the progress upward from that major low was extremely volatile -- perfect for short-term swing traders to capitalize on. APA made a significant cycle high on September 14, 2012, peaking out at 94.87 before embarking on its current bearish trend reversal. The stock has fallen by more than 18% in the last two months and may now be approaching its anticipated time/price projection zone in which its 20-day and 40-day cycles are expected to bottom out prior to a tradable bullish reversal. The green boxes highlight this projected bottoming area; APA should not decline below 70.61 by November 24, 2012, and in fact will likely make its swing low well above that price level. See Figure 2. |

|
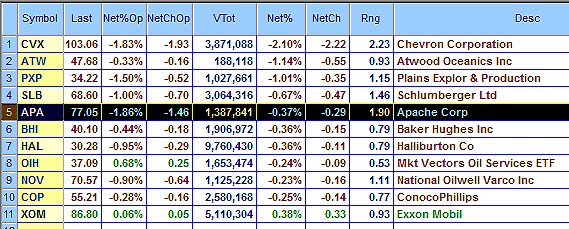
| FIGURE 2: OIL SERVICES. Most major oil/oil services names were in the red again during the early afternoon trading session on Wednesday, November 14, 2012. |
| Graphic provided by: TradeStation. |
| |
| Long-term money flow remains very strong (based on the stock's [CMF][100] histogram), and this means that once APA bottoms in the days ahead, there should be plenty of fresh buying power to help drive the stock back up into at least one (if not both) of the red TP cycle high zones depicted on the chart. A daily close by APA above the dashed blue downtrend line will confirm the new 40-day low is already in place. Once you see it close above that line, it will be far safer to look for a suitable low-risk long entry point. A straight swing trade is probably the best route to travel if this setup manifests as expected. The stock is expected to peak in the red zone(s) well in advance of December option expiration, rendering the use of a December covered-call trade a rather risky proposition, making swing trading look far more attractive. A two- to three-bar trailing stop of the daily lows can be used as the trade management stop for the life of the trade (if actually triggered, obviously) and the resistance area near might prove to be an excellent profit-taking price level for at least half of the position. If you're slightly more bullish, you could opt for a four- or five-bar trail of the daily lows, especially if you believe APA can hit the top of the uppermost red TP zone (near 90.00) within the next three and a half weeks. |
| Many oil exploration/oil producer/oil services stocks have been hit hard over the past two months, and this could be a great time to start preparing a shopping list of the higher-quality (good earnings growth and dividends) energy sector stocks, since many of them are exhibiting daily chart patterns similar to those depicted by APA in Figure 1. Remember to diversify your portfolio as you get back into the market, risking no more than 1% and 2% of your account equity on any single trade. Trade wisely until we meet here again. |
Freelance financial markets writer and online publisher of the Trendzetterz.com S&P 500 Weekly Forecast service.
| Title: | Market consultant and writer |
| Company: | Trendzetterz |
| Address: | 81 Hickory Hollow Drive |
| Crossville, TN 38555 | |
| Phone # for sales: | 904-303-4814 |
| Website: | trendzetterz.com |
| E-mail address: | support@trendzetterz.com |
Traders' Resource Links | |
| Trendzetterz has not added any product or service information to TRADERS' RESOURCE. | |
Click here for more information about our publications!
PRINT THIS ARTICLE

Request Information From Our Sponsors
- VectorVest, Inc.
- Executive Premier Workshop
- One-Day Options Course
- OptionsPro
- Retirement Income Workshop
- Sure-Fire Trading Systems (VectorVest, Inc.)
- Trading as a Business Workshop
- VectorVest 7 EOD
- VectorVest 7 RealTime/IntraDay
- VectorVest AutoTester
- VectorVest Educational Services
- VectorVest OnLine
- VectorVest Options Analyzer
- VectorVest ProGraphics v6.0
- VectorVest ProTrader 7
- VectorVest RealTime Derby Tool
- VectorVest Simulator
- VectorVest Variator
- VectorVest Watchdog
- StockCharts.com, Inc.
- Candle Patterns
- Candlestick Charting Explained
- Intermarket Technical Analysis
- John Murphy on Chart Analysis
- John Murphy's Chart Pattern Recognition
- John Murphy's Market Message
- MurphyExplainsMarketAnalysis-Intermarket Analysis
- MurphyExplainsMarketAnalysis-Visual Analysis
- StockCharts.com
- Technical Analysis of the Financial Markets
- The Visual Investor
