HOT TOPICS LIST
- MACD
- Fibonacci
- RSI
- Gann
- ADXR
- Stochastics
- Volume
- Triangles
- Futures
- Cycles
- Volatility
- ZIGZAG
- MESA
- Retracement
- Aroon
INDICATORS LIST
LIST OF TOPICS
PRINT THIS ARTICLE
by Donald W. Pendergast, Jr.
Shares of Gilead Sciences have just blasted higher from a well-defined consolidation pattern. Does this key health sector issue have enough buying pressure to keep surging higher?
Position: N/A
Donald W. Pendergast, Jr.
Freelance financial markets writer and online publisher of the Trendzetterz.com S&P 500 Weekly Forecast service.
PRINT THIS ARTICLE
CHART ANALYSIS
GILD Bullish Continuation Move?
11/14/12 09:20:39 AMby Donald W. Pendergast, Jr.
Shares of Gilead Sciences have just blasted higher from a well-defined consolidation pattern. Does this key health sector issue have enough buying pressure to keep surging higher?
Position: N/A
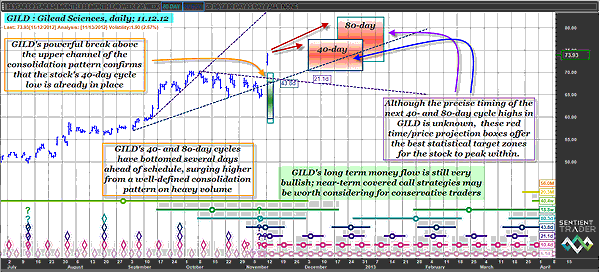
| Although very volatile at times, Gilead Sciences (GILD) common shares can and do frequently go into sustained trending moves that swing and trend-following traders can profit from. Monday's powerful bullish gap in the stock may be the start of yet another run higher in the stock (which is already up by more than 80% since the beginning of 2012). Here's a closer look now to see if GILD really has the potential to make it to 80.00, 85.00, or even 90.00 per share by year-end. See Figure 1. |

|
| FIGURE 1: GILD, DAILY. As far as textbook-quality covered-call chart setups go, this daily breakout in GILD looks to be tailor-made for a December '12 $70.00 covered call. The 43.6-day VTL can be used as a trailing stop for the life of the trade. |
| Graphic provided by: Sentient Trader. |
| |
| GILD made a major multicycle low in late November 2011 when eight different cycles -- ranging from five days to 20 months -- all bottomed simultaneously. From the major low of 34.45, the stock has surged by more than 110% in less than one year, with plenty of violent pullbacks and powerful uptrends along the pathway to its current valuation of 73.93 per share. The stock's semi-tortuous rise since 2011 has featured many flat-base and/or triangle pattern consolidation breakouts, with the majority leading to profitable runs higher in the stock. This latest breakout has taken out the 21-1-day valid trendline (VTL), confirming that GILD's 40-day cycle low is already in place -- about a week earlier than previously projected (see the vertical green box below the price bar); long-term money flow also remains well above its zero line, which is a very positive factor supportive of more upside. |

|
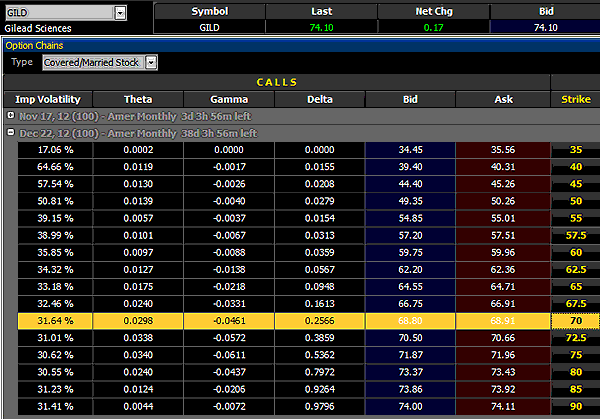
| FIGURE 2: GILD COVERED CALL. The December '12 GILD $70.00 covered call will return close to 18% annualized if the stock closes in-the-money by the end of trading on Friday, December 22, 2012. |
| Graphic provided by: TradeStation. |
| Graphic provided by: OptionStation Pro. |
| |
| Going forward, traders and investors in GILD need to watch the upsloping trendline (the 43.6-day VTL). As long as GILD respects this strong cyclically based support level prior to entering either of the red time/price (TP) projection zones, the probabilities are good that the stock can eventually make it into the upper half of either of those 40- and 80-day cycle high zones sometime between early December 2012 and early January 2013. Playing GILD here might best be done by way of covered-call setups; the December '12 GILD $70.00 covered call is selling for 68.90 (the net cost of 100 shares of GILD less the premiums received for the call option, not including commissions and slippage) (see Figure 2). If GILD expires in-the-money by the third Friday in December, this trade will have yielded an annualized rate of return of about 18%, which is a very nice rate of return in the midst of a global depression. To manage this CC position, consider using that 43.6-day VTL as your de facto trailing stop for the life of the position. GILD may need time to back-and-fill before moving higher again. The use of such a trendline stop can help keep you from being stopped out prematurely. Risk no more than 2% of your trading account capital on this trade and be sure to diversify your stock trading account across at least three to six positions to minimize the impact that an adverse price move in any one of them could have on your portfolio, net worth, and psyche. |
Freelance financial markets writer and online publisher of the Trendzetterz.com S&P 500 Weekly Forecast service.
| Title: | Market consultant and writer |
| Company: | Trendzetterz |
| Address: | 81 Hickory Hollow Drive |
| Crossville, TN 38555 | |
| Phone # for sales: | 904-303-4814 |
| Website: | trendzetterz.com |
| E-mail address: | support@trendzetterz.com |
Traders' Resource Links | |
| Trendzetterz has not added any product or service information to TRADERS' RESOURCE. | |
Click here for more information about our publications!
PRINT THIS ARTICLE

Request Information From Our Sponsors
- VectorVest, Inc.
- Executive Premier Workshop
- One-Day Options Course
- OptionsPro
- Retirement Income Workshop
- Sure-Fire Trading Systems (VectorVest, Inc.)
- Trading as a Business Workshop
- VectorVest 7 EOD
- VectorVest 7 RealTime/IntraDay
- VectorVest AutoTester
- VectorVest Educational Services
- VectorVest OnLine
- VectorVest Options Analyzer
- VectorVest ProGraphics v6.0
- VectorVest ProTrader 7
- VectorVest RealTime Derby Tool
- VectorVest Simulator
- VectorVest Variator
- VectorVest Watchdog
- StockCharts.com, Inc.
- Candle Patterns
- Candlestick Charting Explained
- Intermarket Technical Analysis
- John Murphy on Chart Analysis
- John Murphy's Chart Pattern Recognition
- John Murphy's Market Message
- MurphyExplainsMarketAnalysis-Intermarket Analysis
- MurphyExplainsMarketAnalysis-Visual Analysis
- StockCharts.com
- Technical Analysis of the Financial Markets
- The Visual Investor
