HOT TOPICS LIST
- MACD
- Fibonacci
- RSI
- Gann
- ADXR
- Stochastics
- Volume
- Triangles
- Futures
- Cycles
- Volatility
- ZIGZAG
- MESA
- Retracement
- Aroon
INDICATORS LIST
LIST OF TOPICS
PRINT THIS ARTICLE
by Donald W. Pendergast, Jr.
Shares of National Oilwell Varco have fallen significantly since mid-September 2012, but a bullish reversal may be due soon.
Position: N/A
Donald W. Pendergast, Jr.
Freelance financial markets writer and online publisher of the Trendzetterz.com S&P 500 Weekly Forecast service.
PRINT THIS ARTICLE
CYCLES
National Oilwell Varco Significant Reversal Likely?
11/12/12 09:01:00 AMby Donald W. Pendergast, Jr.
Shares of National Oilwell Varco have fallen significantly since mid-September 2012, but a bullish reversal may be due soon.
Position: N/A
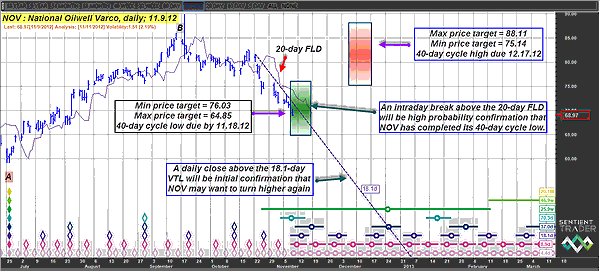
| National Oilwell Varco (NOV) shares have taken a major tumble over the past seven weeks. The stock made a major cycle high on September 18, 2012, at 89.95 and hasn't had more than a minor rally (that lasted a grand total of five trading sessions in October 2012) since then, selling off along with many other big names in the oil services stock group (BHI, HAL, SLB, and so on). However, as the old saying goes, it's always darkest just before the dawn, and there are numerous technical dynamics that are alerting skilled traders that a worthwhile bullish reversal may soon be realized in this key energy player's shares. Here's a closer look now. |

|
| FIGURE 1: NOV, DAILY. After witnessing a large-cap stock post a 30% decline in only seven weeks, some traders and investors might justifiably be wary of timing a long entry in NOV soon, but the cyclical, money flow, and chart/Fibonacci support levels in the stock are all suggesting that a tradable reversal may soon appear. |
| Graphic provided by: Sentient Trader. |
| |
| NOV's long-term money flow (the 100-day Chaikin money flow histogram [CMF][100]) is still hovering near its zero line, despite the stock's 30% decline since mid-September 2012. This is a major clue that the bullish sentiment in the stock wasn't overdone on the correction and that the stock simply needs some sort of a major support level or multicycle low to act as a de facto launchpad for its anticipated bullish reversal. See Figure 1. In fact, NOV has both of those dynamics in play here, too, with the stock now entering the lower half of its 40-day time/price (TP) cycle projection zone (green box). It is close to testing any one of three support levels that could finally trigger a bullish bounce higher: 1. Chart support at 67.00 (the July 24th swing low) 2. Fibonacci support at 65.90, which is 78.6% retracement of major swing AB 3. The bottom of the green cycle TP box, near 64.85. With NOV's long-term money flow still holding up so well, any one of these price levels could witness a final washout of the selling pressure, with a bullish reversal soon to follow. |

|
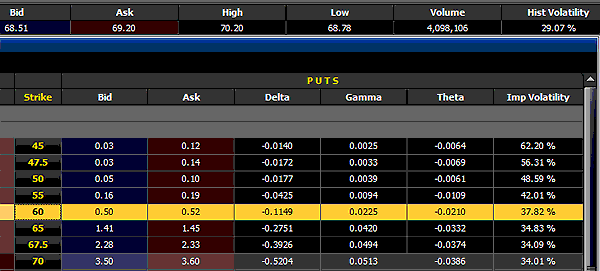
| FIGURE 2: NOV, DAILY. Given the current technical state of NOV's daily chart, selling the Dec. '12 $60.00 puts may offer nimble short-term traders a true smash & grab profit opportunity if they time a put sale right after the stock makes a daily close above its 18.1-day VTL soon. |
| Graphic provided by: TradeStation. |
| Graphic provided by: OptionStation Pro. |
| |
| Note the thin black meandering line just to the right of the current down swing's price bars. This is known as a future line of demarcation (FLD) and any intraday break above it by NOV is a high-probability confirmation that the stock's 40-day cycle low is finally in place and that a bullish reversal is well under way. Unless you have an especially good mechanical trading system that fires a bullish reversal signal before this line is crossed to the upside, it's best to wait for major confirmation like this before taking a new bullish position in NOV. The dashed trendline is also an early warning tool to help spot trend reversals; a daily close above the line (known as a valid trendline, or VTL) will be an important event, one that can give aggressive short-term or intraday traders their first green light regarding a bullish reversal, but most traders should wait for the FLD to be violated before putting on a swing trade. |
| As far as playing NOV for some short-term bullish follow-through goes, consider the possibility of selling the December '12 NOV $60.00 puts on a break above the dashed trendline (currently near 70.00); these puts are selling for $0.50 ($50 per contract before commissions and slippage), they have a tiny delta of only (0.1149) and offer daily time decay of better than $2.00 per day per contract. (See Figure 2.) These puts will rapidly lose value if NOV soon breaks above the trendline and they offer a reasonable amount of protection if the reversal doesn't occur as soon as anticipated -- the strike price of these puts is nearly $5 below the lowest projected price for the green 40-day cycle TP box, giving plenty of margin for timing error. If you sell the puts, buy them back for a loss if they double in price or if NOV makes a daily close below 64.85, whichever comes first. Conversely, if they decline in value by 50% to 60%, buy them back for a nice gain and walk away, happy that you're a regular Traders.com Advantage reader. Be sure to monitor NOV's daily price action during the coming week, as the oil service stocks have a tendency to make powerful moves without much advance notice. As always, trade wisely until we meet here again. |
Freelance financial markets writer and online publisher of the Trendzetterz.com S&P 500 Weekly Forecast service.
| Title: | Market consultant and writer |
| Company: | Trendzetterz |
| Address: | 81 Hickory Hollow Drive |
| Crossville, TN 38555 | |
| Phone # for sales: | 904-303-4814 |
| Website: | trendzetterz.com |
| E-mail address: | support@trendzetterz.com |
Traders' Resource Links | |
| Trendzetterz has not added any product or service information to TRADERS' RESOURCE. | |
Click here for more information about our publications!
PRINT THIS ARTICLE

Request Information From Our Sponsors
- StockCharts.com, Inc.
- Candle Patterns
- Candlestick Charting Explained
- Intermarket Technical Analysis
- John Murphy on Chart Analysis
- John Murphy's Chart Pattern Recognition
- John Murphy's Market Message
- MurphyExplainsMarketAnalysis-Intermarket Analysis
- MurphyExplainsMarketAnalysis-Visual Analysis
- StockCharts.com
- Technical Analysis of the Financial Markets
- The Visual Investor
- VectorVest, Inc.
- Executive Premier Workshop
- One-Day Options Course
- OptionsPro
- Retirement Income Workshop
- Sure-Fire Trading Systems (VectorVest, Inc.)
- Trading as a Business Workshop
- VectorVest 7 EOD
- VectorVest 7 RealTime/IntraDay
- VectorVest AutoTester
- VectorVest Educational Services
- VectorVest OnLine
- VectorVest Options Analyzer
- VectorVest ProGraphics v6.0
- VectorVest ProTrader 7
- VectorVest RealTime Derby Tool
- VectorVest Simulator
- VectorVest Variator
- VectorVest Watchdog
