HOT TOPICS LIST
- MACD
- Fibonacci
- RSI
- Gann
- ADXR
- Stochastics
- Volume
- Triangles
- Futures
- Cycles
- Volatility
- ZIGZAG
- MESA
- Retracement
- Aroon
INDICATORS LIST
LIST OF TOPICS
PRINT THIS ARTICLE
by Gary Grosschadl
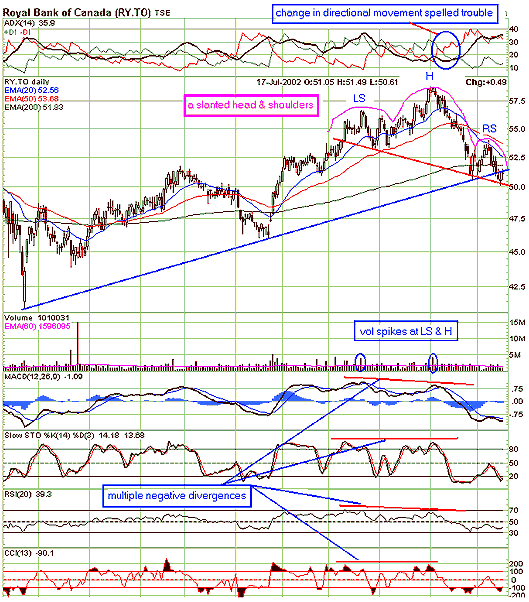
Canada's largest bank is at a crossroads right now. An interesting triple challenge seems to be in the works with what appears to be a slanted head & shoulders topping formation, an important trendline test, and a 200-day EMA challenge.
Position: N/A
Gary Grosschadl
Independent Canadian equities trader and technical analyst based in Peterborough
Ontario, Canada.
PRINT THIS ARTICLE
CHART ANALYSIS
Royal Bank of Canada Facing a Triple Chart Challenge
07/19/02 12:10:49 PMby Gary Grosschadl
Canada's largest bank is at a crossroads right now. An interesting triple challenge seems to be in the works with what appears to be a slanted head & shoulders topping formation, an important trendline test, and a 200-day EMA challenge.
Position: N/A
| Backing up a bit, trouble began for the Royal Bank of Canada at its recent top as the stock weakened through the $57.50 mark. The short-term trader had several telling clues here. Directional movement (ADX) had a bearish DI crossover hinting that the sellers/bears were taking control. To add fuel to this growing fire there are several negative divergences with the indicators displayed on the chart. These indicators failed to set new highs when price action did. This led to a sizeable decline through the 20- and 50-day exponential moving averages (EMAs), all the way down to the all important 200-day EMA. Note the bearish crossover of the 20/50 EMA. |

|
| Graphic provided by: stockcharts.com. |
| |
| This brings us to this stock's current dilemma: If the Royal Bank does not quickly bounce off this 10-month trendline and climb back above the nearby 200-day EMA at 51.83, it could be in for some serious trouble as the somewhat unconventional head and shoulder formation suggests. A breakdown here could easily lead to testing the previous congestion zone at $45 - $47. It should be noted that the volume profile is not ideal here. Although volume spikes at the left shoulder and head, there is no increase in volume during the decline from the head and right shoulder. This makes the pattern a little suspect. |
| The bottom line though, does not change -- weakness below $50 spells trouble as three key areas have been violated. You can bank on it. |
Independent Canadian equities trader and technical analyst based in Peterborough
Ontario, Canada.
| Website: | www.whatsonsale.ca/financial.html |
| E-mail address: | gwg7@sympatico.ca |
Click here for more information about our publications!
PRINT THIS ARTICLE

Request Information From Our Sponsors
- StockCharts.com, Inc.
- Candle Patterns
- Candlestick Charting Explained
- Intermarket Technical Analysis
- John Murphy on Chart Analysis
- John Murphy's Chart Pattern Recognition
- John Murphy's Market Message
- MurphyExplainsMarketAnalysis-Intermarket Analysis
- MurphyExplainsMarketAnalysis-Visual Analysis
- StockCharts.com
- Technical Analysis of the Financial Markets
- The Visual Investor
- VectorVest, Inc.
- Executive Premier Workshop
- One-Day Options Course
- OptionsPro
- Retirement Income Workshop
- Sure-Fire Trading Systems (VectorVest, Inc.)
- Trading as a Business Workshop
- VectorVest 7 EOD
- VectorVest 7 RealTime/IntraDay
- VectorVest AutoTester
- VectorVest Educational Services
- VectorVest OnLine
- VectorVest Options Analyzer
- VectorVest ProGraphics v6.0
- VectorVest ProTrader 7
- VectorVest RealTime Derby Tool
- VectorVest Simulator
- VectorVest Variator
- VectorVest Watchdog
