HOT TOPICS LIST
- MACD
- Fibonacci
- RSI
- Gann
- ADXR
- Stochastics
- Volume
- Triangles
- Futures
- Cycles
- Volatility
- ZIGZAG
- MESA
- Retracement
- Aroon
INDICATORS LIST
LIST OF TOPICS
PRINT THIS ARTICLE
by Koos van der Merwe
The Toronto 300 has many gold mining stocks in it, which can affect and definitely does influence the movement of the index. Can it be used to determine the movement of the Standard & Poor's 500?
Position: N/A
Koos van der Merwe
Has been a technical analyst since 1969, and has worked as a futures and options trader with First Financial Futures in Johannesburg, South Africa.
PRINT THIS ARTICLE
ELLIOTT WAVE
The Toronto 300 Index And The Fiscal Cliff
11/13/12 08:14:19 AMby Koos van der Merwe
The Toronto 300 has many gold mining stocks in it, which can affect and definitely does influence the movement of the index. Can it be used to determine the movement of the Standard & Poor's 500?
Position: N/A
| Predicting the direction of the stock market at the moment is not as easy as expected. There are too many fundamental uncertainties, the primary one at the moment being the "fiscal cliff," which is what President Barack Obama decides he must do when the terms of the Budget Control Act of 2011 are scheduled to go into effect at the end of 2012, and what the Republicans are pushing for. There is no doubt that an agreement will be reached, the problem being to how agreement will be weighted. The general feeling is that a middle course that will address the budget issue to a limited extent will be followed. This will have only a modest impact on growth. |

|
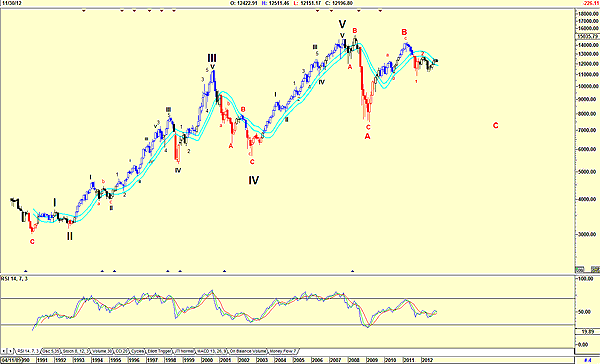
| FIGURE 1: TSX 300. A semi-log monthly chart of the Toronto 300 index with a wave count. |
| Graphic provided by: AdvancedGET. |
| |
| Figure 1 is a monthly chart of the Toronto 300 index. The Elliott wave count shown suggests that a major correction down is on the cards. The chart is a semi-log chart and the wave count, which follows the first rule of Elliott wave theory, namely "the count must look correct," suggests a major C-wave down in the anticipated five waves. This suggests that an agreement between the Republican-controlled House of Representatives and President Obama will not happen, to the detriment of the market. |

|
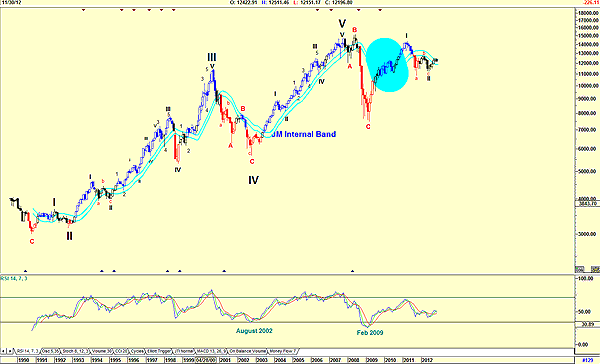
| FIGURE 2: TSX 300. A semi-log monthly chart of the TSX 300 with an alternate wave count. |
| Graphic provided by: AdvancedGET. |
| |
| Figure 2 is the same chart in Figure 1, but adopting a more bullish view, suggesting that the ABC expected correction has occurred and that the index is now in a new bull trend. The only negative to this wave count is highlighted in blue. Wave 1 is not a rise in five waves. The relative strength index (RSI), which gave a buy signal in February 2009, is still suggesting strength, as is the JM internal band Indicator, a 15-period moving average offset by 2% positive and 2% negative. The index is testing the JM internal band. A move above the upper band suggests a buy and the start of a new bull run. |

|
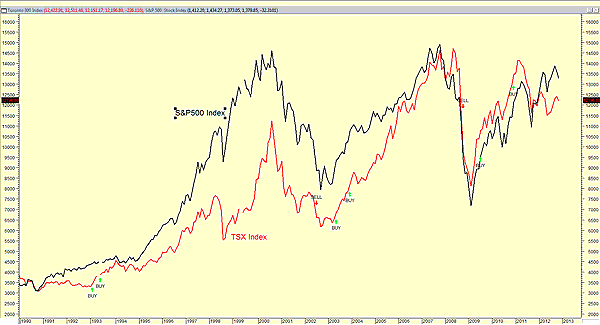
| FIGURE 3: TSX 300. A chart comparing the movement of the TSX to the S&P 500. |
| Graphic provided by: MetaStock. |
| |
| Figure 3 is a chart showing how closely the Standard & Poor's 500 and the TSX 300 follow each other. Whether the S&P 500 leads the TSX 300 or vice versa, it is obvious that the next two months will be critical to the movement of the market. Let us just hope that US politics does not take precedence over the economic health and well being of the US and (of course) Canada. |
Has been a technical analyst since 1969, and has worked as a futures and options trader with First Financial Futures in Johannesburg, South Africa.
| Address: | 3256 West 24th Ave |
| Vancouver, BC | |
| Phone # for sales: | 6042634214 |
| E-mail address: | petroosp@gmail.com |
Click here for more information about our publications!
PRINT THIS ARTICLE

Request Information From Our Sponsors
- StockCharts.com, Inc.
- Candle Patterns
- Candlestick Charting Explained
- Intermarket Technical Analysis
- John Murphy on Chart Analysis
- John Murphy's Chart Pattern Recognition
- John Murphy's Market Message
- MurphyExplainsMarketAnalysis-Intermarket Analysis
- MurphyExplainsMarketAnalysis-Visual Analysis
- StockCharts.com
- Technical Analysis of the Financial Markets
- The Visual Investor
- VectorVest, Inc.
- Executive Premier Workshop
- One-Day Options Course
- OptionsPro
- Retirement Income Workshop
- Sure-Fire Trading Systems (VectorVest, Inc.)
- Trading as a Business Workshop
- VectorVest 7 EOD
- VectorVest 7 RealTime/IntraDay
- VectorVest AutoTester
- VectorVest Educational Services
- VectorVest OnLine
- VectorVest Options Analyzer
- VectorVest ProGraphics v6.0
- VectorVest ProTrader 7
- VectorVest RealTime Derby Tool
- VectorVest Simulator
- VectorVest Variator
- VectorVest Watchdog
