HOT TOPICS LIST
- MACD
- Fibonacci
- RSI
- Gann
- ADXR
- Stochastics
- Volume
- Triangles
- Futures
- Cycles
- Volatility
- ZIGZAG
- MESA
- Retracement
- Aroon
INDICATORS LIST
LIST OF TOPICS
PRINT THIS ARTICLE
by Donald W. Pendergast, Jr.
Shares of Home Depot are up by more than 100% since August 2012, but money flow analysis is warning of a substantial correction ahead.
Position: N/A
Donald W. Pendergast, Jr.
Freelance financial markets writer and online publisher of the Trendzetterz.com S&P 500 Weekly Forecast service.
PRINT THIS ARTICLE
CHART ANALYSIS
Home Depot Bearish Divergence With Price
11/08/12 11:36:02 AMby Donald W. Pendergast, Jr.
Shares of Home Depot are up by more than 100% since August 2012, but money flow analysis is warning of a substantial correction ahead.
Position: N/A
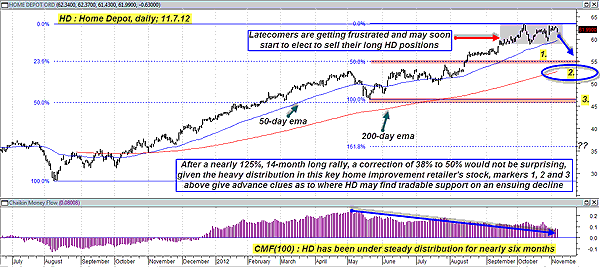
| Home Depot (HD) shares have enjoyed a remarkably smooth ascent since making a mega-multicycle low on August 9, 2011. That was right after the worst of the euro-scare market panic on mid-summer 2011 had finally run its course, dropping many fundamentally attractive large-cap stocks down to bargain-level prices. HD bottomed at 28.13, and over the course of the next 14 months, the stock managed to make it as high as 63.20 in early October 2012. Long-term money flow has remained above its zero line since December 19, 2011, with the Chaikin money flow (CMF)(100) histogram peaking on May 10, 2012. For the last six months, however, money has steadily been flowing out of HD. You can see this proved out on the chart -- note how the successive money flow histogram peaked and since May 2012 has been making lower highs even as the stock itself went on to make new highs (Figure 1). This is evidence of distribution, where those who built big long positions in the stock just before and right after the major August 2011 low began to scale out of such positions starting in May 2012, selling them to latecomers, odd-lotters, and others who missed the fist major rally up from the lows into the spring of 2012. These latecomers are the primary driving force behind the lower-volume (after all, the CMF is based on volume and price action) second-stage surge in the stock into early October 2012. |

|
| FIGURE 1: HD, DAILY. Note how much choppier the rally from May to October 2012 was compared to the August 2011 to May 2012 rally. With the smart money distributing their shares of Home Depot to lesser-informed investors and traders over the past 25 weeks, the probability of a major correction increases with each passing day. |
| Graphic provided by: MetaStock. |
| Graphic provided by: MetaStock Explorer. |
| |
| What we see now is that even these latecomers have finally seen the light, realizing that HD is going to need a correction before it can garner enough new incoming market fuel (a new wave of profit-hungry buyers eager for gains after a major pullback) and now appear ready to unload at least a portion of their own long HD positions. If this trend accelerates, then HD will likely make a swift move down to its 50-day exponential moving average (EMA), currently near 59.50. However, it's extremely doubtful that HD will muster more than a tiny bounce off that EMA and will instead choose to head down to one, if not all three of the following support areas over the next few weeks and/or months: 1. A key Fibonacci confluence support near 55.00 (top pink horizontal line) 2. The 200-day EMA, currently near 52.75 3. An even more important Fibonacci confluence support zone between 45.75/46.50; this one coincides with the May 2012 swing low in HD. The first support area should be good for a tradable short-covering rally, but make sure you rely on a mechanical system buy signal to time your entry, being careful to not overstay your welcome on such a relief rally. The 200-day EMA support should also be good for an even better rally, particularly if the stock's long-term money flow remains above its zero line (Figure 2). If the (CMF) (100) is still hanging above zero at that point, a buy signal there could be a lower-risk proposition. Finally, consider the lowest support zone, way down in the mid-$40 range. Again, look at the long-term money flow before deciding to go long or not; negative money flow means that any long trades you take should be short term in nature, with modest profit targets. |

|
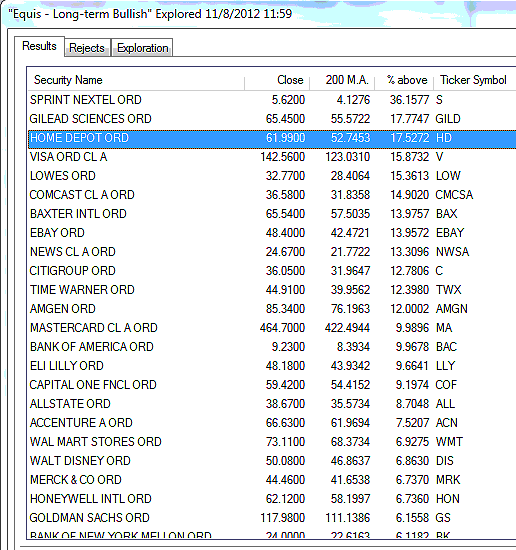
| FIGURE 2: COMPONENT STOCKS. The .OEX component stocks that are trading well above their respective 200-day moving averages as of Wednesday, November 7, 2012. |
| Graphic provided by: MetaStock. |
| Graphic provided by: MetaStock Explorer. |
| |
| As far as capitalizing on the potential for a large-scale slide in HD goes, for all but the most experienced traders, short selling is probably too risky and you should just rely on the followng three things to help you make money: 1. A sell signal from a short- to medium-term mechanical trading system 2. Slightly in-the-money put options with at least three to four months of time value 3. Logical stop, trailing stop, and profit target levels for each long put option trade you seek to capitalize on. The broad market seems to have cast its own vote regarding the outcome of Tuesday's Presidential election, and if the price action of many key large caps is any indication, it stands to reason that traders, investors, and other believers in capitalism and free market economics really aren't too pleased about it. Look for the selling to continue until word of some sort of responsible solution to the fiscal cliff issue is revealed. Until we meet here again, trade wisely! |
Freelance financial markets writer and online publisher of the Trendzetterz.com S&P 500 Weekly Forecast service.
| Title: | Market consultant and writer |
| Company: | Trendzetterz |
| Address: | 81 Hickory Hollow Drive |
| Crossville, TN 38555 | |
| Phone # for sales: | 904-303-4814 |
| Website: | trendzetterz.com |
| E-mail address: | support@trendzetterz.com |
Traders' Resource Links | |
| Trendzetterz has not added any product or service information to TRADERS' RESOURCE. | |
Click here for more information about our publications!
PRINT THIS ARTICLE

Request Information From Our Sponsors
- VectorVest, Inc.
- Executive Premier Workshop
- One-Day Options Course
- OptionsPro
- Retirement Income Workshop
- Sure-Fire Trading Systems (VectorVest, Inc.)
- Trading as a Business Workshop
- VectorVest 7 EOD
- VectorVest 7 RealTime/IntraDay
- VectorVest AutoTester
- VectorVest Educational Services
- VectorVest OnLine
- VectorVest Options Analyzer
- VectorVest ProGraphics v6.0
- VectorVest ProTrader 7
- VectorVest RealTime Derby Tool
- VectorVest Simulator
- VectorVest Variator
- VectorVest Watchdog
- StockCharts.com, Inc.
- Candle Patterns
- Candlestick Charting Explained
- Intermarket Technical Analysis
- John Murphy on Chart Analysis
- John Murphy's Chart Pattern Recognition
- John Murphy's Market Message
- MurphyExplainsMarketAnalysis-Intermarket Analysis
- MurphyExplainsMarketAnalysis-Visual Analysis
- StockCharts.com
- Technical Analysis of the Financial Markets
- The Visual Investor
