

HOT TOPICS LIST
- MACD
- Fibonacci
- RSI
- Gann
- ADXR
- Stochastics
- Volume
- Triangles
- Futures
- Cycles
- Volatility
- ZIGZAG
- MESA
- Retracement
- Aroon
INDICATORS LIST
LIST OF TOPICS
PRINT THIS ARTICLE
by Donald W. Pendergast, Jr.
Shares of Goldman Sachs are approaching a key resistance level. Does the stock have enough fuel in the tank to make it to 128.72 or higher anytime soon?
Position: N/A
Donald W. Pendergast, Jr.
Freelance financial markets writer and online publisher of the Trendzetterz.com S&P 500 Weekly Forecast service.
PRINT THIS ARTICLE
SUPPORT & RESISTANCE
Goldman Sachs Nearing Major Resistance
11/07/12 09:36:04 AMby Donald W. Pendergast, Jr.
Shares of Goldman Sachs are approaching a key resistance level. Does the stock have enough fuel in the tank to make it to 128.72 or higher anytime soon?
Position: N/A
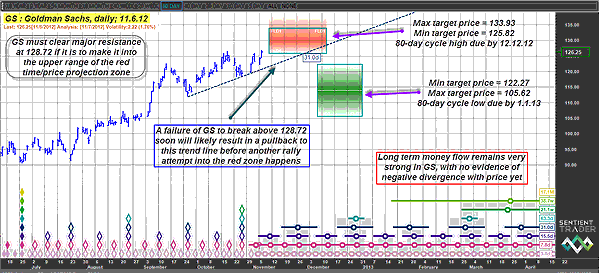
| Of all the major financial stocks, few make smoother swing and/or trending moves than that of investment banking powerhouse Goldman Sachs (GS). The stock is getting close to challenging its last major swing high resistance level of 128.72, made in late March 2012. The daily chart for GS (Figure 1) looks plenty bullish, but is there enough buying pressure to move GS back into new high territory? Here's a closer look now. |
|
| FIGURE 1: GS, DAILY. The 31-day VTL (valid trendline) on this chart is the real division line between bulls and bears; mechanical buy signals above the line could lead to a strong move into the red TP zone, while the opposite is true if you see a mechanical sell signal occur with GS trading below the line. |
| Graphic provided by: Sentient Trader. |
| |
| As with many other big financial sector stocks, GS made a major multicycle low in late June 2012. In GS's case, no less than eight cycles (ranging from four days to 17 months in length) bottomed at the same time, setting up a solid foundation for the strong rally that eventually ensued. Since that early summer low, GS rose from 90.43 all the way to 126.73 as of November 6, 2012, a rise of better than 40%. The rally offered many opportunities for skilled swing traders to profit from and even offered a nice trending phase that longer-term traders would have been pleased with, too. With the stock having just broken above a minor resistance level on Election Day, it look as if the bulls in this financial high-flier may be preparing for another swing higher, one that they would like to see meet and/or exceed that March 2012 high of 128.72. Long-term money flow (based on the 100-day Chaikin money flow histogram [CMF][100]) in the stock is excellent, with no sign yet of any bearish price/money flow divergence, and that is an important consideration for anyone planning to go long GS. Note the 31-day valid trendline (VTL). It offers many advance clues as to where GS will find likely support for a rise into its anticipated 80-day cycle high (red time/price (TP) projection zone) and also where a break below it after a successful rise into the red zone will likely lead to a significant corrective move down into the stock's next 80-day cycle low (green TP zone). See Figure 2. |
|
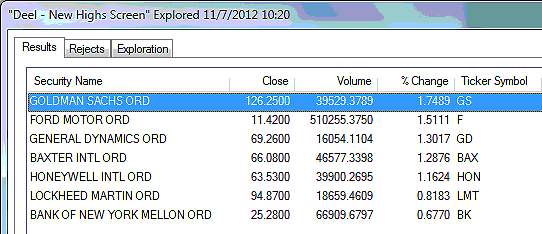
| FIGURE 2: COMPONENT STOCKS. The .OEX component stocks making new multimonth and/or multiyear highs on Tuesday, November 6, 2012. |
| Graphic provided by: MetaStock. |
| Graphic provided by: MetaStock Explorer. |
| |
| Based on intraday price action in GS on the day after the elections, it appears that there is a minor battle under way between the smart money interests who are unloading a portion of their GS holdings prior to this next move higher and traders/investors who think that this minor decline offers a prime buying opportunity to grab shares of the stock at a discount from Tuesday's high of 126.73. For what it's worth, GS's five-, 10-, 20-, 40-, and 80-day cycles are all suggesting more near-term upside in GS, so what may be going on today is the continuation of a consolidation just prior to a final surge higher into late November-early December 2012. Whichever way GS finally decides to break, the red/green TP zones offer a rational, statistically based forecast for where the stock is most likely to travel during the next eight weeks or so. Look for mechanical buy signals on either side of that key trendline of the chart (long if above the line and short if below the line) to alert you to the lowest risk trade opportunities in GS, using the TP zones as profit taking/risk reduction price levels. Risk no more than 2% of your account equity on any stock trade and keep your emotions and personal trading biases out of your trading decision making process, no matter how bullish/bearish you may be on GS right now. |
Freelance financial markets writer and online publisher of the Trendzetterz.com S&P 500 Weekly Forecast service.
| Title: | Market consultant and writer |
| Company: | Trendzetterz |
| Address: | 81 Hickory Hollow Drive |
| Crossville, TN 38555 | |
| Phone # for sales: | 904-303-4814 |
| Website: | trendzetterz.com |
| E-mail address: | support@trendzetterz.com |
Traders' Resource Links | |
| Trendzetterz has not added any product or service information to TRADERS' RESOURCE. | |
Click here for more information about our publications!
PRINT THIS ARTICLE

Request Information From Our Sponsors
- StockCharts.com, Inc.
- Candle Patterns
- Candlestick Charting Explained
- Intermarket Technical Analysis
- John Murphy on Chart Analysis
- John Murphy's Chart Pattern Recognition
- John Murphy's Market Message
- MurphyExplainsMarketAnalysis-Intermarket Analysis
- MurphyExplainsMarketAnalysis-Visual Analysis
- StockCharts.com
- Technical Analysis of the Financial Markets
- The Visual Investor
- VectorVest, Inc.
- Executive Premier Workshop
- One-Day Options Course
- OptionsPro
- Retirement Income Workshop
- Sure-Fire Trading Systems (VectorVest, Inc.)
- Trading as a Business Workshop
- VectorVest 7 EOD
- VectorVest 7 RealTime/IntraDay
- VectorVest AutoTester
- VectorVest Educational Services
- VectorVest OnLine
- VectorVest Options Analyzer
- VectorVest ProGraphics v6.0
- VectorVest ProTrader 7
- VectorVest RealTime Derby Tool
- VectorVest Simulator
- VectorVest Variator
- VectorVest Watchdog