HOT TOPICS LIST
- MACD
- Fibonacci
- RSI
- Gann
- ADXR
- Stochastics
- Volume
- Triangles
- Futures
- Cycles
- Volatility
- ZIGZAG
- MESA
- Retracement
- Aroon
INDICATORS LIST
LIST OF TOPICS
PRINT THIS ARTICLE
by Donald W. Pendergast, Jr.
Shares of Starbucks Corp. leaped higher by more than 9% on November 2, 2012, but how much more room to run does this bellwether large-cap stock really have?
Position: N/A
Donald W. Pendergast, Jr.
Freelance financial markets writer and online publisher of the Trendzetterz.com S&P 500 Weekly Forecast service.
PRINT THIS ARTICLE
CYCLES
Starbucks And Its Powerful Breakout, Doubtful Near-Term Trend
11/05/12 08:50:31 AMby Donald W. Pendergast, Jr.
Shares of Starbucks Corp. leaped higher by more than 9% on November 2, 2012, but how much more room to run does this bellwether large-cap stock really have?
Position: N/A
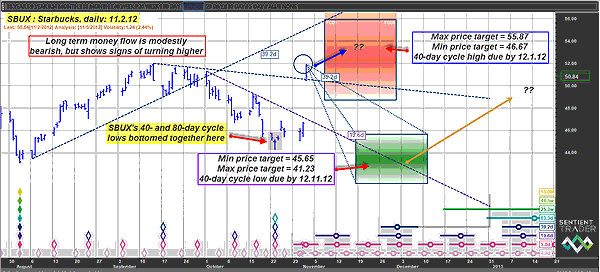
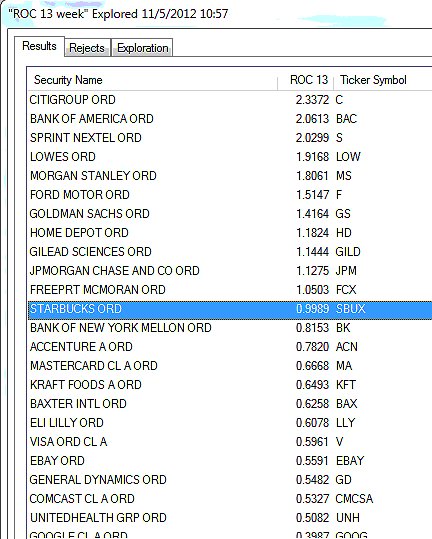
| Anytime a large-cap stock manages to gap higher and complete a trading session with a 9% gain (close-to-prior close basis) on better than a 175% increasing in average daily volume, you know that it's the smart money at work in the markets once again. Just one look at SBUX's daily cycles chart (Figure 1) confirms the power of last Friday's breakout -- note how the stock smashed right through the two dashed trendlines on its pathway higher. Its daily close above both lines confirmed that its recent low (on October 23, 2012) was indeed a simultaneous bottoming of its 40- and 80-day price cycles. Given that SBUX's long-term money flow trend is only mildly bearish, not far below its zero line, this big volume surge higher may very well be the tipoff that the stock is now in the beginning stages of a major bullish trend reversal. That late October 2012 swing low also printed at a price level significantly higher than the previous major low of August 2, 2012, and the new break higher now confirms SBUX's uptrend. So far, so good; the stock has made a significant low, is now in an uptrend, big money appears to be the force behind its latest surge and the stock is easily outperforming the .OEX and .SPX over the past 13 weeks (Figure 2). All told, the chart paints a generally bullish image, but the real sticking point is that big red box on the chart. That's the time/price zone in which SBUX's next projected 40-day cycle high is anticipated to top out sometime between November 8 and December 1, 2012. The stock could run as high as 55.87 before peaking again and has already ascended well into the price area in which a reversal lower might be expected. Without knowing exactly what this stock might do in the days and weeks ahead, the probabilities are high that SBUX will experience near-term profit taking and/or sideways price action before grinding higher into mid- to late November 2012. |

|
| FIGURE 1: SBUX, DAILY. Long-term cycles and chart analysis suggests that SBUX may be in the early stages of a major, bullish trend reversal. Near term, however, it's unlikely that the stock will exceed the 54.00/55.00 area by early December 2012. |
| Graphic provided by: Sentient Trader. |
| |
| For all anyone knows, the outcome of Tuesday's Presidential election could also be a bullish factor that might spark a broad market rally. Anyone currently short the market should be prepared to cover, just in case. Once SBUX finally makes that next 40-day cycle high, the analysis also favors a decline lower into the green time/price (TP) projection zone. Note that the lower portion of the box is actually lower than the August 2012 swing low, but if the long-term money flow rises above its zero line, it's unlikely that SBUX will decline that low. The upper portion of the green TP zone is a more likely price target for the stock's next noticeable pullback. The time window for the next 40-day cycle low is between November 18 and December 11, 2012, but don't be surprised if SBUX makes the low sooner rather than later. |

|
| FIGURE 2: OUTPERFORMANCE. SBUX has been outperforming the .OEX and .SPX over the past 13 weeks. |
| Graphic provided by: MetaStock. |
| Graphic provided by: MetaStock Explorer. |
| |
| At the moment, trading SBUX from the long side looks risky in terms of risk/reward standpoint, but skilled option traders might want to consider the possibility of selling a December '12 SBUX $55.00 call option as a purely speculative trade (risking no more than 1% of your account equity, maximum). Note that the call's strike price coincides with the upper price target of the red TP zone and that its delta is a mere 0.1879. SBUX will have to do some heavy lifting before this call will get near that $55.00 strike, and with a daily time decay of $1.25 per contract, the option is slowly but steadily shedding its time value. The call is currently selling for about $0.43 ($43 per contract before commissions and slippage) but patient, skilled option traders might want to wait for the stock to attempt another rally in order to get a better price on the sale of this out-of-the-money call. If you can get $0.50 per contract on a near-term rally, that might be an excellent place to start selling these calls. Trade management is simple: 1. If the call makes a daily close above 55.00, buy it back immediately. 2. If the call declines in value by 50% to 60% of the sales price, buy it back and walk away happy -- maybe celebrate your victory with a nice latte or two! Monitor the price action of SBUX over the next few days and see if a short-term election rally doesn't help get you set up for a profitable short call play in SBUX. As always, trade wisely until we meet here again. |
Freelance financial markets writer and online publisher of the Trendzetterz.com S&P 500 Weekly Forecast service.
| Title: | Market consultant and writer |
| Company: | Trendzetterz |
| Address: | 81 Hickory Hollow Drive |
| Crossville, TN 38555 | |
| Phone # for sales: | 904-303-4814 |
| Website: | trendzetterz.com |
| E-mail address: | support@trendzetterz.com |
Traders' Resource Links | |
| Trendzetterz has not added any product or service information to TRADERS' RESOURCE. | |
Click here for more information about our publications!
PRINT THIS ARTICLE

Request Information From Our Sponsors
- StockCharts.com, Inc.
- Candle Patterns
- Candlestick Charting Explained
- Intermarket Technical Analysis
- John Murphy on Chart Analysis
- John Murphy's Chart Pattern Recognition
- John Murphy's Market Message
- MurphyExplainsMarketAnalysis-Intermarket Analysis
- MurphyExplainsMarketAnalysis-Visual Analysis
- StockCharts.com
- Technical Analysis of the Financial Markets
- The Visual Investor
- VectorVest, Inc.
- Executive Premier Workshop
- One-Day Options Course
- OptionsPro
- Retirement Income Workshop
- Sure-Fire Trading Systems (VectorVest, Inc.)
- Trading as a Business Workshop
- VectorVest 7 EOD
- VectorVest 7 RealTime/IntraDay
- VectorVest AutoTester
- VectorVest Educational Services
- VectorVest OnLine
- VectorVest Options Analyzer
- VectorVest ProGraphics v6.0
- VectorVest ProTrader 7
- VectorVest RealTime Derby Tool
- VectorVest Simulator
- VectorVest Variator
- VectorVest Watchdog
