HOT TOPICS LIST
- MACD
- Fibonacci
- RSI
- Gann
- ADXR
- Stochastics
- Volume
- Triangles
- Futures
- Cycles
- Volatility
- ZIGZAG
- MESA
- Retracement
- Aroon
INDICATORS LIST
LIST OF TOPICS
PRINT THIS ARTICLE
by Donald W. Pendergast, Jr.
Shares of Baxter International are in the midst of a bullish continuation move at the moment, but this surge higher may be approaching a potential price target.
Position: N/A
Donald W. Pendergast, Jr.
Freelance financial markets writer and online publisher of the Trendzetterz.com S&P 500 Weekly Forecast service.
PRINT THIS ARTICLE
CHART ANALYSIS
Baxter Int'l Approaches A Potential Price Target
11/05/12 10:45:52 AMby Donald W. Pendergast, Jr.
Shares of Baxter International are in the midst of a bullish continuation move at the moment, but this surge higher may be approaching a potential price target.
Position: N/A
| To the eyes of skilled technicians and chart watchers, there can be little doubt that shares of Baxter International (BAX) are well into a bullish continuation move, one that launched after the stock made a multicycle low on August 24, 2012. The big question now, of course, is this: just how far will this stock go before its current continuation move finally exhausts itself? Here's a closer look now. |

|
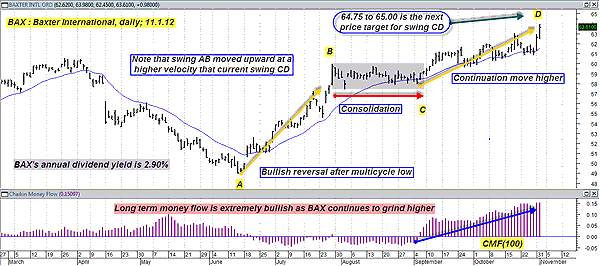
| FIGURE 1: BAX, DAILY. With swing CD now closing in on a potential price target between 64.75 and 65.00, existing longs in shares of Baxter International (BAX) should be running closer stops and or considering the use of protective puts. |
| Graphic provided by: MetaStock. |
| |
| Figure 1, this daily chart of BAX, has many interconnected technical dynamics at work, and they are all suggesting that the stock may soon hit an area where profit-taking may begin. First of all, note how much more powerful that swing AB was compared to the current swing in the stock, CD. Swing AB managed to rise by 10.98 points in six weeks (an average of 1.83 points per week), whereas swing CD is up 6.03 points in five weeks (an average of only 1.21 points per week). Clearly, the continuation move higher from BAX's July-September 2012 consolidation zone has been less robust, albeit still very impressive. Since BAX's long-term money flow (based on the 100-day Chaikin money flow (CMF)(100)) histogram is at a near-record high (and unsustainable), it is suggesting that the stock may be entering the terminal phase of the bullish continuation. If we take swing AB's profit of 10.98 points and multiply it by Fibonacci ratio 0.618, we come up with 6.79 points as a potential point target for the current swing. That would put BAX at somewhere near 64.74, as a near-term swing high is made in the stock. Using a more optimistic Fibonacci ratio of 1.00 would result in a potential price target of 68.93, but it is very doubtful that BAX can hit that target without first experiencing a noticeable corrective move -- a move that would complete swing CD anyway. So be warned ahead of time that 64.75 to 65.00 is likely going to be an area of at least some profit taking in BAX as we move into November. No market forecasting method is perfect, but these estimates look very reasonable in light of BAX's waning momentum, unsustainable money flow peak, and swing length relationships. See Figure 2. |

|
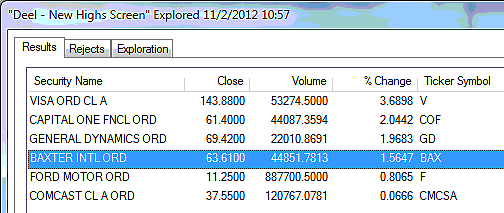
| FIGURE 2: COMPONENT STOCKS. Six .OEX component stocks made new multimonth or multiyear highs on November 1, 2012. |
| Graphic provided by: MetaStock. |
| Graphic provided by: Deel New Highs screen from MetaStock 11. |
| |
| Skilled short traders might want to look for BAX to make an RSI(10) daily close reading of 75 or greater, followed by a key reversal bar before considering shorting this stock. The reversal bar should be about as long as the bar finishing the anticipated final surge higher to 75 or higher, and a decline in price below the low of that reversal bar might serve as the trigger for a short-term, short trade entry. BAX's 21-day exponential moving average (EMA) and its 50-day EMA are currently near 61.53 and 60.41, respectively, and either of these EMAs could serve as solid price targets for such a hypothetical trade. Keep your account risk at 2% or less if this setup appears as anticipated, being sure to keep your emotions under control so you don't get overly attached to any particular market bias or outcome. As always, trade wisely until we meet here again. |
Freelance financial markets writer and online publisher of the Trendzetterz.com S&P 500 Weekly Forecast service.
| Title: | Market consultant and writer |
| Company: | Trendzetterz |
| Address: | 81 Hickory Hollow Drive |
| Crossville, TN 38555 | |
| Phone # for sales: | 904-303-4814 |
| Website: | trendzetterz.com |
| E-mail address: | support@trendzetterz.com |
Traders' Resource Links | |
| Trendzetterz has not added any product or service information to TRADERS' RESOURCE. | |
Click here for more information about our publications!
Comments

Request Information From Our Sponsors
- StockCharts.com, Inc.
- Candle Patterns
- Candlestick Charting Explained
- Intermarket Technical Analysis
- John Murphy on Chart Analysis
- John Murphy's Chart Pattern Recognition
- John Murphy's Market Message
- MurphyExplainsMarketAnalysis-Intermarket Analysis
- MurphyExplainsMarketAnalysis-Visual Analysis
- StockCharts.com
- Technical Analysis of the Financial Markets
- The Visual Investor
- VectorVest, Inc.
- Executive Premier Workshop
- One-Day Options Course
- OptionsPro
- Retirement Income Workshop
- Sure-Fire Trading Systems (VectorVest, Inc.)
- Trading as a Business Workshop
- VectorVest 7 EOD
- VectorVest 7 RealTime/IntraDay
- VectorVest AutoTester
- VectorVest Educational Services
- VectorVest OnLine
- VectorVest Options Analyzer
- VectorVest ProGraphics v6.0
- VectorVest ProTrader 7
- VectorVest RealTime Derby Tool
- VectorVest Simulator
- VectorVest Variator
- VectorVest Watchdog
