HOT TOPICS LIST
- MACD
- Fibonacci
- RSI
- Gann
- ADXR
- Stochastics
- Volume
- Triangles
- Futures
- Cycles
- Volatility
- ZIGZAG
- MESA
- Retracement
- Aroon
INDICATORS LIST
LIST OF TOPICS
PRINT THIS ARTICLE
by Gary Grosschadl
This one-year gold chart shows the recent weakness in gold markets via a rising wedge failure.
Position: N/A
Gary Grosschadl
Independent Canadian equities trader and technical analyst based in Peterborough
Ontario, Canada.
PRINT THIS ARTICLE
WEDGE FORMATIONS
Gold's Bearish Rising Wedge and The London Gold Fix
07/18/02 11:06:18 AMby Gary Grosschadl
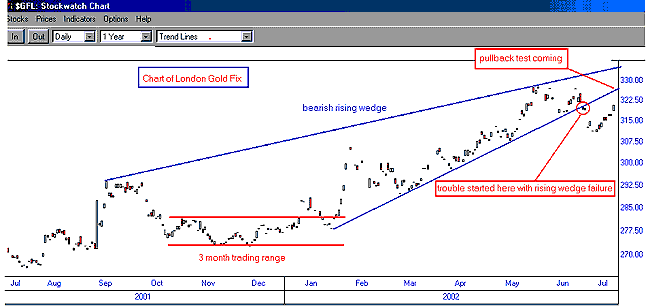
This one-year gold chart shows the recent weakness in gold markets via a rising wedge failure.
Position: N/A
| Rather than charting gold futures such as Comex gold, you can also chart the London Gold Fix as they are very similar. This quaint British custom takes place at 10:30 a.m. and 3 p.m., like clockwork. The same ceremony has been performed the same way, in the same place, and with mostly the same firms participating since the first gold fixing was enacted at Rothschild in St. Swithin's Lane on Friday, Sept. 12th, 1919. So the price of gold is "fixed" twice daily in London by the five members of the London gold pool, all members of the London Bullion Market Association. Actually this entails just two snapshots of the spot price of gold at those moments, which allows the five members to establish a market price fixed only for that precise moment, at which time they can balance their sales and purchase requirements, including orders and commissions from clients. |
| This chart of the gold fix happens to show the wedge formation using the chosen trendlines, and does a nice job of showing how gold got in trouble recently. Note the rising wedge failure and the immediate breakdown that followed. The chart clearly shows the pullback test coming and this may be significant. This leads to three likely scenarios. 1. The pullback test has already failed slightly early at $320 especially if the gold price goes below 315 again and we go down from here. 2. Failure at or near the trendline (also previous top test), around 325 - 327, which can then result in retracement to $300 - 275, if not 250 - 200 on the super bearish side. 3. A successful test of lower trendline which leads to possible test of upper trendline around 335, and then perhaps a spike move to 350 which I have alluded to in previous articles. |

|
| Graphic provided by: Stockwatch. |
| |
| This third scenario begs a question that super gold bulls might ask: Will a move above the bearish wedge negate the bearish implications leading to a much bigger move to $400 - 500? Now that would be an interesting scenario. However it is more prudent at this stage to await the outcome to this potentially bearish formation. The most pressing matter right now would be additional weakness that might bring gold further down instead of challenging the $320s. Bearish below $315 and very bearish below $310. Watch for the resolution of this interesting formation. |
Independent Canadian equities trader and technical analyst based in Peterborough
Ontario, Canada.
| Website: | www.whatsonsale.ca/financial.html |
| E-mail address: | gwg7@sympatico.ca |
Click here for more information about our publications!
Comments
Date: 07/19/02Rank: 5Comment: Your article could nt have come a moment too soon since I have been waiting for optimum entry into this market. On Friday (today) gold had nice upday but mining stocks either stayed the same or went up just a little. This makes me very wary. Maybe traders are expecting an intermediate bottom followed by a suckers short rally and don t want to get caught in a gold bull trap.

Request Information From Our Sponsors
- StockCharts.com, Inc.
- Candle Patterns
- Candlestick Charting Explained
- Intermarket Technical Analysis
- John Murphy on Chart Analysis
- John Murphy's Chart Pattern Recognition
- John Murphy's Market Message
- MurphyExplainsMarketAnalysis-Intermarket Analysis
- MurphyExplainsMarketAnalysis-Visual Analysis
- StockCharts.com
- Technical Analysis of the Financial Markets
- The Visual Investor
- VectorVest, Inc.
- Executive Premier Workshop
- One-Day Options Course
- OptionsPro
- Retirement Income Workshop
- Sure-Fire Trading Systems (VectorVest, Inc.)
- Trading as a Business Workshop
- VectorVest 7 EOD
- VectorVest 7 RealTime/IntraDay
- VectorVest AutoTester
- VectorVest Educational Services
- VectorVest OnLine
- VectorVest Options Analyzer
- VectorVest ProGraphics v6.0
- VectorVest ProTrader 7
- VectorVest RealTime Derby Tool
- VectorVest Simulator
- VectorVest Variator
- VectorVest Watchdog
