

HOT TOPICS LIST
- MACD
- Fibonacci
- RSI
- Gann
- ADXR
- Stochastics
- Volume
- Triangles
- Futures
- Cycles
- Volatility
- ZIGZAG
- MESA
- Retracement
- Aroon
INDICATORS LIST
LIST OF TOPICS
PRINT THIS ARTICLE
by Donald W. Pendergast, Jr.
Shares of Ford experienced a very bullish price/volume breakout on October 31, 2012. Is this the start of a major trending move, or is this simply a fakeout?
Position: N/A
Donald W. Pendergast, Jr.
Freelance financial markets writer and online publisher of the Trendzetterz.com S&P 500 Weekly Forecast service.
PRINT THIS ARTICLE
Ford Motor's Powerful Breakout
11/02/12 09:37:57 AMby Donald W. Pendergast, Jr.
Shares of Ford experienced a very bullish price/volume breakout on October 31, 2012. Is this the start of a major trending move, or is this simply a fakeout?
Position: N/A
| Ford Motor Co. (F) shares made a major multicycle low on August 2, 2012, as eight separate cycles bottomed simultaneously. The low of 8.82 resulted, and the stock has gained more than 26%, with a sizable amount of that gain occurring in just one trading session, on October 31, 2012. While it's common for a large-cap stock like Ford to make large percentage price gains in the wake of a major low, sometimes the gains unfold in a series of violent fits and starts rather than as a smooth, gently undulating trend move. The latter scenario seems to be playing out now in Ford shares, and a look at some key cycle and money flow studies might also help keep traders and investors from getting overly bullish on Ford in the near future. Here's a closer look now. |
|
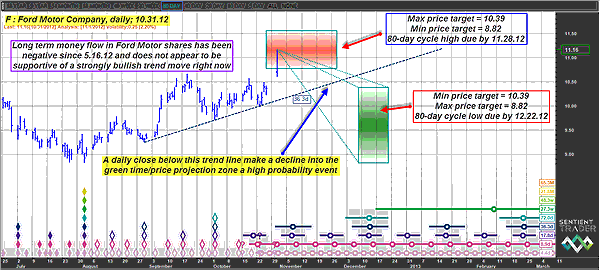
| FIGURE 1: F, DAILY. Although the recent breakout in shares of Ford (F) look very bullish, be aware that the stock's long-term money flow has remained negative for nearly six months, and it is anticipated to make a major cycle high sometime in November 2012. |
| Graphic provided by: Sentient Trader. |
| |
| One of the first things that swing and position traders need to look at before considering a stock trade is its long-term money flow trend/pattern (Figure 1). They can use on-balance volume (OBV), accumulation/distribution (AccDis), or even the Chaikin money flow (CMF) histogram to see if money is flowing into or out of the stock and see if their trading strategy (system or discretionary) has an edge, depending on the level of price/volume bullishness/bearishness in the stock. In the case of Ford, its long-term money flow trend (CMF)(100) has been nagative for nearly six months, having dropped beneath its zero line on May 16, 2012, and never once rising into bullish territory since then. That's the first reason that this latest breakout in Ford is suspect, and the second one is this: the stock is already trading within the anticipated time/price projection window of its 80-day cycle, one that has a price range of 10.77 to 11.55. Further, the stock is also expected to make its 80-day cycle high by no later than November 28, 2012. The takeaway here is that Ford shares will likely move up a bit more before the combined power of poor long-term money flow and an imminent major cycle high conspire to throw a monkey wrench into this latest surge higher in the stock. There also exists a strong Fibonacci resistance confluence zone in the 11.30 to 11.40 area, and that could also act as a powerful reversal trigger for the stock. See Figure 2. |
|
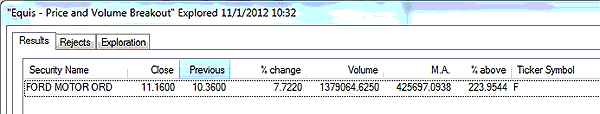
| FIGURE 2: COMPONENT STOCK. Ford was the lone .OEX component stock making a significant price/volume breakout on October 31, 2012. |
| Graphic provided by: MetaStock. |
| Graphic provided by: MetaStock Explorer. |
| |
| Once Ford's 80-day cycle high is achieved, there is a very high probability of the stock retracing anywhere from 50% to 100% of the gains made during its August to November 2012 rally, with a major cycle low anticipated to be in place by December 8 to 22, 2012. The forecasted price range for the low of the 80-day cycle comes between 8.82 and 10.39. As you may already know, cycle forecasts can morph, and near-term forecasts can be more accurate than longer-term ones in many stocks. The big idea here is to use caution if attempting to play Ford on the long side for speculative profits, as the odds of success are rather limited. You would stand a much better chance of profiting by simply waiting for it to make a daily close below the bullish trendline on the chart and then buying some in-the-money puts with two to three months of time value. You could use the trendline as an initial stop-loss and then hold the options until they either double in price or decline in value by 50%. Risk no more than 2% on this potential setup, and be sure to monitor it at least once or twice a day so you'll always know what's going on. Trade wisely until we meet here again. |
Freelance financial markets writer and online publisher of the Trendzetterz.com S&P 500 Weekly Forecast service.
| Title: | Market consultant and writer |
| Company: | Trendzetterz |
| Address: | 81 Hickory Hollow Drive |
| Crossville, TN 38555 | |
| Phone # for sales: | 904-303-4814 |
| Website: | trendzetterz.com |
| E-mail address: | support@trendzetterz.com |
Traders' Resource Links | |
| Trendzetterz has not added any product or service information to TRADERS' RESOURCE. | |
Click here for more information about our publications!
PRINT THIS ARTICLE

Request Information From Our Sponsors
- StockCharts.com, Inc.
- Candle Patterns
- Candlestick Charting Explained
- Intermarket Technical Analysis
- John Murphy on Chart Analysis
- John Murphy's Chart Pattern Recognition
- John Murphy's Market Message
- MurphyExplainsMarketAnalysis-Intermarket Analysis
- MurphyExplainsMarketAnalysis-Visual Analysis
- StockCharts.com
- Technical Analysis of the Financial Markets
- The Visual Investor
- VectorVest, Inc.
- Executive Premier Workshop
- One-Day Options Course
- OptionsPro
- Retirement Income Workshop
- Sure-Fire Trading Systems (VectorVest, Inc.)
- Trading as a Business Workshop
- VectorVest 7 EOD
- VectorVest 7 RealTime/IntraDay
- VectorVest AutoTester
- VectorVest Educational Services
- VectorVest OnLine
- VectorVest Options Analyzer
- VectorVest ProGraphics v6.0
- VectorVest ProTrader 7
- VectorVest RealTime Derby Tool
- VectorVest Simulator
- VectorVest Variator
- VectorVest Watchdog