HOT TOPICS LIST
- MACD
- Fibonacci
- RSI
- Gann
- ADXR
- Stochastics
- Volume
- Triangles
- Futures
- Cycles
- Volatility
- ZIGZAG
- MESA
- Retracement
- Aroon
INDICATORS LIST
LIST OF TOPICS
PRINT THIS ARTICLE
by Donald W. Pendergast, Jr.
Shares of Coeur d'Alene Mining Corp. may be on the verge of finally breaking above a very strong, 14-month-old resistance zone.
Position: N/A
Donald W. Pendergast, Jr.
Freelance financial markets writer and online publisher of the Trendzetterz.com S&P 500 Weekly Forecast service.
PRINT THIS ARTICLE
CDE Cycle High Due?
11/02/12 08:32:04 AMby Donald W. Pendergast, Jr.
Shares of Coeur d'Alene Mining Corp. may be on the verge of finally breaking above a very strong, 14-month-old resistance zone.
Position: N/A
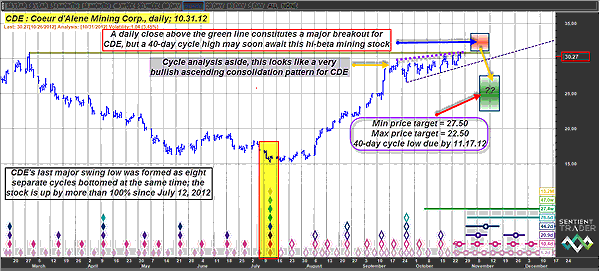
| For trend-followers of precious metals mining stocks, the common shares of Coeur d'Alene Mining Corp. (CDE) appear to be tailor-made for those who appreciate the ability of certain stocks to make sustained, megatrend moves several times per year. In the last eight months, CDE plunged from nearly 31.00 to 15.15 and then managed to climb all the way back up to 31.00, causing the trend-followers in this stock to have numerous winning trades along the way. With the stock now looking as if it might be able to finally close above a very strong area of resistance at 31.00, will it be able to rack up more impressive gains going into November 2012, or will it instead fizzle out and make a proportional pullback? Here's a closer look at CDE's daily cycles chart now (Figure 1). |

|
| FIGURE 1: CDE, DAILY. It's possible that a push higher by CDE into the red time/price cycle projection zone could be viewed by inexperienced traders as another opportunity to get onboard with new long positions, just as the smart money in the stock decides to give them all the stock they can handle. |
| Graphic provided by: Sentient Trader. |
| |
| In the wake of its major multicycle low on July 12, 2012, CDE has managed to tack on a gain of nearly 106% in less than 16 weeks. With the stock now attempting to break higher from a bullish ascending pattern at a key resistance area, the bulls in this metals miners stock are intently watching to see if there is significant follow-through on a daily close above 31.00. Long-term money flow is still at an extremely high level, but it is already starting to manifest signs of negative divergence with price, and that's probably a warning sign that the rally may be due for a breather soon. Confirming the validity of that money flow warning is the fact that CDE's 40-day cycle is due to peak (in the red time/price projection zone) no later than November 11, 2012, somewhere in the range between 31.08 and 33.56. |

|
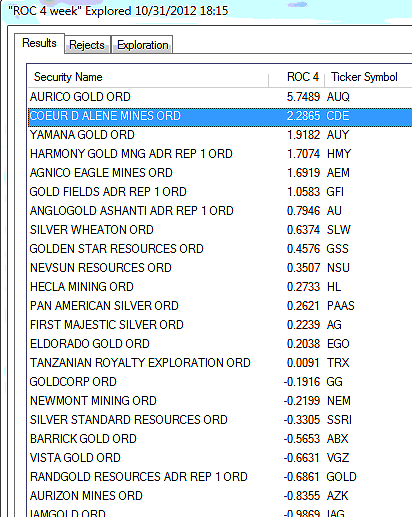
| FIGURE 2: RELATIVE STRENGTH. CDE boasts excellent bullish relative strength versus GDX over the past four weeks. |
| Graphic provided by: MetaStock. |
| Graphic provided by: MetaStock Explorer. |
| |
| The probabilities are very good that CDE will make it into that red TP zone by the second week of November 2012, and yet at the same time the probabilities are just as high (if not higher) that such a late surge will draw in many latecomers to the rally just as the smart money players decide to finish unloading the remaining quantities of their existing long positions in the stock, thus setting the stage for a sharp, swift drop by CDE into the green TP zone. If this 40-day cycle study output is accurate, CDE should drop to somewhere between 22.50 to 27.50 by no later than November 17, 2012. While this might seem to be an awfully bearish forecast to some traders and technicians, a quick glance at CDE's daily price chart reveals that this stock can and does make all kinds of powerful reversals, and a sharp pullback after a 106% rally shouldn't be all that surprising to experienced traders and investors. See Figure 2. |
| Playing CDE here for a potential rise into the red TP zone could be a bit risky here, because even though the stock has an excellent chance of posting some more upside, the probabilities of a major shock reversal grow larger with each trading session. Therefore, most traders should wait for a solid mechanical short sell signal and then use slightly in-the-money put options to capitalize on what may be a noticeable decline in this stock within the next couple of weeks. Once you get your mechanical short sell signal (a break below a 10-day channel low might be a great short trigger in CDE now), start pricing the various January 2013 puts in CDE, looking to buy puts with a delta of -0.60 of better. Consider using the top of the green TP zone as your basic price target for the trade, buying your puts back if they hit 27.50 or if they double in price or decline in value by 50% (whichever occurs first). Risk no more than 2% of your account equity on this or any other trade, and as always, trade wisely until we meet here again. |
Freelance financial markets writer and online publisher of the Trendzetterz.com S&P 500 Weekly Forecast service.
| Title: | Market consultant and writer |
| Company: | Trendzetterz |
| Address: | 81 Hickory Hollow Drive |
| Crossville, TN 38555 | |
| Phone # for sales: | 904-303-4814 |
| Website: | trendzetterz.com |
| E-mail address: | support@trendzetterz.com |
Traders' Resource Links | |
| Trendzetterz has not added any product or service information to TRADERS' RESOURCE. | |
Click here for more information about our publications!
Comments

Request Information From Our Sponsors
- StockCharts.com, Inc.
- Candle Patterns
- Candlestick Charting Explained
- Intermarket Technical Analysis
- John Murphy on Chart Analysis
- John Murphy's Chart Pattern Recognition
- John Murphy's Market Message
- MurphyExplainsMarketAnalysis-Intermarket Analysis
- MurphyExplainsMarketAnalysis-Visual Analysis
- StockCharts.com
- Technical Analysis of the Financial Markets
- The Visual Investor
- VectorVest, Inc.
- Executive Premier Workshop
- One-Day Options Course
- OptionsPro
- Retirement Income Workshop
- Sure-Fire Trading Systems (VectorVest, Inc.)
- Trading as a Business Workshop
- VectorVest 7 EOD
- VectorVest 7 RealTime/IntraDay
- VectorVest AutoTester
- VectorVest Educational Services
- VectorVest OnLine
- VectorVest Options Analyzer
- VectorVest ProGraphics v6.0
- VectorVest ProTrader 7
- VectorVest RealTime Derby Tool
- VectorVest Simulator
- VectorVest Variator
- VectorVest Watchdog
