HOT TOPICS LIST
- MACD
- Fibonacci
- RSI
- Gann
- ADXR
- Stochastics
- Volume
- Triangles
- Futures
- Cycles
- Volatility
- ZIGZAG
- MESA
- Retracement
- Aroon
INDICATORS LIST
LIST OF TOPICS
PRINT THIS ARTICLE
by Koos van der Merwe
Gold is a currency hedge. When the US dollar weakens, gold shares should rise.
Position: Accumulate
Koos van der Merwe
Has been a technical analyst since 1969, and has worked as a futures and options trader with First Financial Futures in Johannesburg, South Africa.
PRINT THIS ARTICLE
STRATEGIES
Is It Time To Start Buying Gold?
11/01/12 08:55:21 AMby Koos van der Merwe
Gold is a currency hedge. When the US dollar weakens, gold shares should rise.
Position: Accumulate
| When gold was no longer fixed at $35 per ounce and it was allowed to float, the US dollar became the currency against which all the currencies of the world were measured as to performance. In 1971, President Richard Nixon announced that the USA would no longer redeem currency for gold. The gold standard was finally abandoned. The appeal of the gold standard is, however, still strong as a control against inflation, but its return will probably not happen. The price of gold still very much influences the movement of the US dollar, and vice versa. |

|
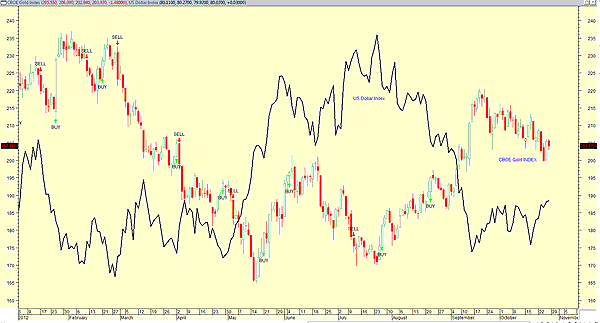
| FIGURE 1: The CBOE GOLD INDEX VS. US DOLLAR INDEX |
| Graphic provided by: MetaStock. |
| |
| Figure 1 is a chart showing how the CBOE Gold Index (CBOE) movers versus the US Dollar Index. When the US Dollar Index rises, the CBOE Gold Index falls, and vice versa. A look at the chart shows this very clearly. What does the future hold? |

|
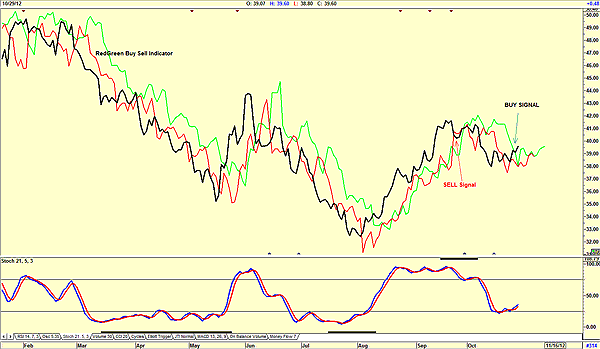
| FIGURE 2: BARRICK GOLD SUGGESTING A BUY |
| Graphic provided by: AdvancedGET. |
| |
| Figure 2 is a daily chart of Barrick Gold Corp (ABX-T). The red-green buy sell indicator is a one-period moving average offset by 10 periods (green line) and a one-period moving average offset by six periods (red line). A move above the green line is a buy signal, and a move below the red line is a sell signal. The share price has given a buy signal on October 29. Note the stochastic 21,5,3 indicator has also given a buy signal. |

|
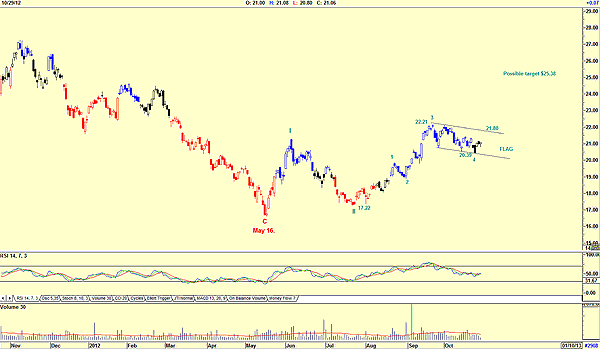
| FIGURE 3: I-UNITS GOLD INDEX |
| Graphic provided by: AdvancedGET. |
| |
| In Figure 3, I am showing the Canadian i-Units Gold Index, which appears to be forming a bullish flag pattern. The pattern is suggesting that a break above the upper resistance line at approximately $21.80 will see the price target, $25.38 (22.21 - 17.22 = 4.99 + 20.39 = 25.38). The 14-period relative strength index (RSI), however, is still weak, suggesting that further weakness lies ahead. The Elliott wave count following the first rule does look correct, but this count could change as the price develops. A trader could look at gold shares as suggested in Figure 2. A more cautious investor could wait for the i-Units Gold Index to give a buy signal before looking at gold shares. The advantage of buying the index rather that the share of any mining company is that mining expenses is not included in movement of the index. |
Has been a technical analyst since 1969, and has worked as a futures and options trader with First Financial Futures in Johannesburg, South Africa.
| Address: | 3256 West 24th Ave |
| Vancouver, BC | |
| Phone # for sales: | 6042634214 |
| E-mail address: | petroosp@gmail.com |
Click here for more information about our publications!
PRINT THIS ARTICLE

Request Information From Our Sponsors
- VectorVest, Inc.
- Executive Premier Workshop
- One-Day Options Course
- OptionsPro
- Retirement Income Workshop
- Sure-Fire Trading Systems (VectorVest, Inc.)
- Trading as a Business Workshop
- VectorVest 7 EOD
- VectorVest 7 RealTime/IntraDay
- VectorVest AutoTester
- VectorVest Educational Services
- VectorVest OnLine
- VectorVest Options Analyzer
- VectorVest ProGraphics v6.0
- VectorVest ProTrader 7
- VectorVest RealTime Derby Tool
- VectorVest Simulator
- VectorVest Variator
- VectorVest Watchdog
- StockCharts.com, Inc.
- Candle Patterns
- Candlestick Charting Explained
- Intermarket Technical Analysis
- John Murphy on Chart Analysis
- John Murphy's Chart Pattern Recognition
- John Murphy's Market Message
- MurphyExplainsMarketAnalysis-Intermarket Analysis
- MurphyExplainsMarketAnalysis-Visual Analysis
- StockCharts.com
- Technical Analysis of the Financial Markets
- The Visual Investor
