HOT TOPICS LIST
- MACD
- Fibonacci
- RSI
- Gann
- ADXR
- Stochastics
- Volume
- Triangles
- Futures
- Cycles
- Volatility
- ZIGZAG
- MESA
- Retracement
- Aroon
INDICATORS LIST
LIST OF TOPICS
PRINT THIS ARTICLE
by Donald W. Pendergast, Jr.
Shares of Williams Cos. have experienced a particularly strong rally since October 2011. Is the latest pullback in the stock a buying opportunity?
Position: N/A
Donald W. Pendergast, Jr.
Freelance financial markets writer and online publisher of the Trendzetterz.com S&P 500 Weekly Forecast service.
PRINT THIS ARTICLE
SUPPORT & RESISTANCE
WMB Pullback To Support?
11/01/12 08:32:49 AMby Donald W. Pendergast, Jr.
Shares of Williams Cos. have experienced a particularly strong rally since October 2011. Is the latest pullback in the stock a buying opportunity?
Position: N/A
| Energy sector stocks can and do make very strong trending moves, and with shares of Williams Cos., Inc. (WMB), up more than 110% between October 4, 2011, and October 4, 2012, the stock has been of great interest to traders and investors alike over the past 13 months. With this key energy stock now resting near its 50-day exponential moving average (EMA), is this a good time to prepare for yet another surge higher, or is it time to stand aside and take a wait-and-see approach instead? Here's a closer look at WMB's technicals now. |

|
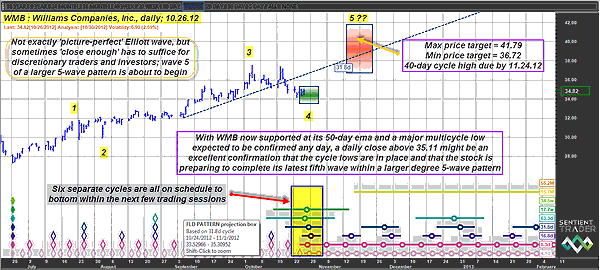
| FIGURE 1: WMB, DAILY. With long-term money flow, price cycle, support/resistance, and Elliott wave studies all confirming a high probability of yet another swing higher, all the stock really needs is a break above 35.11 by November 1 to draw in a new crowd of eager buyers. |
| Graphic provided by: Sentient Trader. |
| |
| WMB's nearly 13-month-long rally unfolded it into two separate trend thrusts; the first one launched higher from the major October 4, 2011, multicycle low -- where eight of its price cycles bottomed simultaneously -- and rose nearly 100% by May 1, 2012. Then a seven-week-long, five-wave corrective pattern ensued, one that brought WMB just beneath its all-important 200-day EMA, forming yet another major multicycle low (this time based on seven converging cycles making a low together on June 22, 2012). Elliotticians may not agree, but this writer believes that the late June 2012 low was a wave 4 (of the complex corrective wave variety) and that WMB is now nearing the end of its complete five-wave pattern that has its root in the October 2011 low. Elliott patterns -- just like price cycle lengths -- are not always perfectly formed but are sometimes a bit messy and misshapen and need a trained eye that can separate the wheat from the chaff. Be that as it may, if we look at WMB's current 40-day cycle forecast, we find that the stock is already well within its green time/price (TP) projection zone, one that also is suggesting that as many as six different cycles (ranging from four days to 18 weeks in length) are all right on schedule to bottom sometime this week or early next week. See Figure 1. For the 40-week cycle, the low is expected to be in place by November 1, 2012, and the low should be at or above 33.52 for this forecast to be accurate. Long-term money flow in WMB remains at very bullish levels, with only minor negative price/money flow divergences evident, so all WMB really needs here is a good solid close above 35.11 to get the next phase of its Elliott wave 5 of a larger wave 5 pattern to rise up into the red TP zone between November 13 and 24, 2012. The price range for this anticipated terminal surge should be between 36.72 and 41.79. Obviously, if wave 5 peaks in the lower portion of the red TP zone and below the peak of wave 3, the wave will be a failure swing and the subsequent selling pressure in the stock could be unleashed very quickly, driving the stock lower in the first phase of a major trend reversal, A-B-C type corrective wave pattern. See Figure 2. |

|
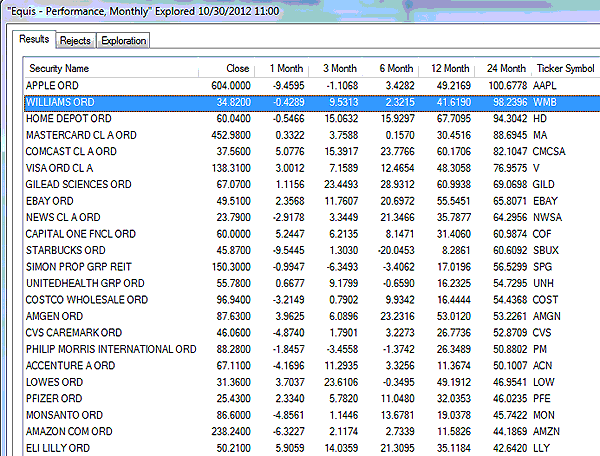
| FIGURE 2: 24-MONTH PERFORMANCE. Shares of Williams Cos. (WMB) have performed nearly as well as those of Apple Inc. (AAPL) over the past 24 months; both are up about 100% during that time period. |
| Graphic provided by: MetaStock. |
| Graphic provided by: MetaStock Explorer. |
| |
| Playing WMB on the long side is dirt-simple -- buy on a break above 35.11 and then run a two- to three-bar trailing stop of the daily lows until the final stopout. Consider booking partial profits if the prior swing high price of 37.39 is reached, just in case wave 5 decides it's had enough and decides to close up shop. Risk no more than 2% of your account equity on this trade and be very nimble due to the likelihood of extra market volatility on Wednesday and Thursday this week as the US stock markets resume operations in the wake of Sandy's devastation of the Northeastern US. |
Freelance financial markets writer and online publisher of the Trendzetterz.com S&P 500 Weekly Forecast service.
| Title: | Market consultant and writer |
| Company: | Trendzetterz |
| Address: | 81 Hickory Hollow Drive |
| Crossville, TN 38555 | |
| Phone # for sales: | 904-303-4814 |
| Website: | trendzetterz.com |
| E-mail address: | support@trendzetterz.com |
Traders' Resource Links | |
| Trendzetterz has not added any product or service information to TRADERS' RESOURCE. | |
Click here for more information about our publications!
PRINT THIS ARTICLE

Request Information From Our Sponsors
- VectorVest, Inc.
- Executive Premier Workshop
- One-Day Options Course
- OptionsPro
- Retirement Income Workshop
- Sure-Fire Trading Systems (VectorVest, Inc.)
- Trading as a Business Workshop
- VectorVest 7 EOD
- VectorVest 7 RealTime/IntraDay
- VectorVest AutoTester
- VectorVest Educational Services
- VectorVest OnLine
- VectorVest Options Analyzer
- VectorVest ProGraphics v6.0
- VectorVest ProTrader 7
- VectorVest RealTime Derby Tool
- VectorVest Simulator
- VectorVest Variator
- VectorVest Watchdog
- StockCharts.com, Inc.
- Candle Patterns
- Candlestick Charting Explained
- Intermarket Technical Analysis
- John Murphy on Chart Analysis
- John Murphy's Chart Pattern Recognition
- John Murphy's Market Message
- MurphyExplainsMarketAnalysis-Intermarket Analysis
- MurphyExplainsMarketAnalysis-Visual Analysis
- StockCharts.com
- Technical Analysis of the Financial Markets
- The Visual Investor
