HOT TOPICS LIST
- MACD
- Fibonacci
- RSI
- Gann
- ADXR
- Stochastics
- Volume
- Triangles
- Futures
- Cycles
- Volatility
- ZIGZAG
- MESA
- Retracement
- Aroon
INDICATORS LIST
LIST OF TOPICS
PRINT THIS ARTICLE
by Donald W. Pendergast, Jr.
Shares of Amazon finally found support near their 200-day exponential moving average on Friday. Is this the start of a fresh rally or merely a technical bounce before larger declines?
Position: N/A
Donald W. Pendergast, Jr.
Freelance financial markets writer and online publisher of the Trendzetterz.com S&P 500 Weekly Forecast service.
PRINT THIS ARTICLE
Amazon.com Cycle Low, Short-Covering, Or Both?
10/31/12 10:52:38 AMby Donald W. Pendergast, Jr.
Shares of Amazon finally found support near their 200-day exponential moving average on Friday. Is this the start of a fresh rally or merely a technical bounce before larger declines?
Position: N/A
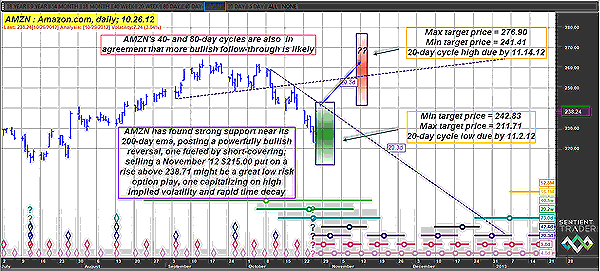
| At certain times, several key technical dynamics will all converge near a particular time/price zone, providing traders with a heightened sense of confidence regarding the near-term direction of a stock, index, or futures contract. In the case of Amazon (AMZN), three price cycles are in agreement that a significant cycle low either has been or is close to being completed, with the stock's key long-term moving average also in agreement that a bullish reversal was due. The big question now is whether this strong bounce is the start of a significant new rally or merely part of a larger corrective pattern that might eventually retrace a good part of the entire December 2011 to September 2012 rally. Here's a closer look as we seek some answers from AMZN's daily cycles chart (Figure 1). |

|
| FIGURE 1: AMZN, DAILY. While no one knows just how far Amazon will carry on this latest bullish reversal, the risk/reward profile for a near-term, out-of-the-money short put play look very attractive if the stock rises above Friday's high of 238.71. |
| Graphic provided by: Sentient Trader. |
| |
| After making a major multicycle low on December 29, 2011, AMZN regained bullish momentum, risng in a pattern of violent fits and starts by as much as 58% by mid-September 2012. Strong sales of Amazon's Kindle reader helped fuel increasingly bullish earnings and sales projections during the uptrend, but long-term money flow began to noticeably diverge from the stock's rising trend by late July 2012, only six weeks before AMZN made its run to 264.11 per share. The selloff over the last six weeks hasn't been overly panic-driven (but still has plenty of bearish momentum), and its closely watched 200-day exponential moving average (EMA) has so far acted as strong support, allowing for a sharp bullish reversal late last week. Normally, a decline like this usually turns out to be wave A of a large A-B-C corrective pattern against the previous long-term uptrend, so we'll have to wait and see just how far this current short-covering rally goes before attempting to confirm that. Current cycle studies in AMZN suggest that the stock's next 20-day cycle high is expected to peak between November 10-14, 2012, with the minimum price target of 241.41 and a maximum price target of 276.90. If AMZN peaks out in the lower half red time/price (TP) zone and fails to rise much above the upper horizontal trendline on the chart, a confirmed high of wave B would likely be confirmed. However, if AMZN manages to rise well into the top end of the red TP zone, the A-B-C correction forecast will need to be revised and/or put on hold. There is simply no precise way to call a market's exact turning points, but this latest 20-day cycle study output does provide a valuable frame of technical reference. |

|
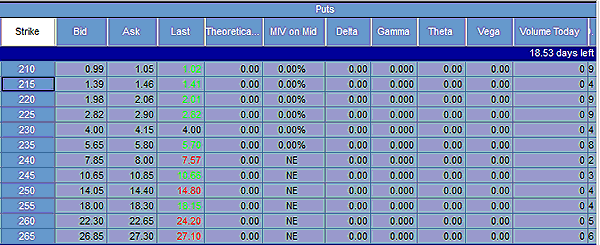
| FIGURE 2: PUTS. The November '12 AMZN $215.00 puts are well below a major area of support near 223.00, helping make a near-term sale of these puts an attractive risk/reward proposition. |
| Graphic provided by: TradeStation. |
| |
| AMZN's long-term money flow (based on the 100-day Chaikin money flow (CMF)(100) is still above its zero line, and since it appears that AMZN has indeed completed its 20-day cycle low (green TP zone) a little early, now might be a good time to set up a short-term play in the stock. By selling a November '12 $215.00 put option on a rise above 238.71 in AMZN (Figure 2), you'll be taking advantage of the stock's rapid, ever-increasing time decay, its tiny delta and a strong area of support at the stocks 200-day EMA and 20-day cycle low near the 223.00 area. If it is filled at a price of 1.30 or better, simply manage the trade by buying it back if it declines in value by 50% or rises in price by 100%. If you feel really confident about AMZN's prospect for a rally into the red zone, you might want to hold out for more gains, trying to keep at least 75-80% of the premium you received for it before buying it back. Risk no more than 2% of your account value no matter how bullish you may be on this stock. Remember, trade wisely until we meet here again. |
Freelance financial markets writer and online publisher of the Trendzetterz.com S&P 500 Weekly Forecast service.
| Title: | Market consultant and writer |
| Company: | Trendzetterz |
| Address: | 81 Hickory Hollow Drive |
| Crossville, TN 38555 | |
| Phone # for sales: | 904-303-4814 |
| Website: | trendzetterz.com |
| E-mail address: | support@trendzetterz.com |
Traders' Resource Links | |
| Trendzetterz has not added any product or service information to TRADERS' RESOURCE. | |
Click here for more information about our publications!
Comments

Request Information From Our Sponsors
- StockCharts.com, Inc.
- Candle Patterns
- Candlestick Charting Explained
- Intermarket Technical Analysis
- John Murphy on Chart Analysis
- John Murphy's Chart Pattern Recognition
- John Murphy's Market Message
- MurphyExplainsMarketAnalysis-Intermarket Analysis
- MurphyExplainsMarketAnalysis-Visual Analysis
- StockCharts.com
- Technical Analysis of the Financial Markets
- The Visual Investor
- VectorVest, Inc.
- Executive Premier Workshop
- One-Day Options Course
- OptionsPro
- Retirement Income Workshop
- Sure-Fire Trading Systems (VectorVest, Inc.)
- Trading as a Business Workshop
- VectorVest 7 EOD
- VectorVest 7 RealTime/IntraDay
- VectorVest AutoTester
- VectorVest Educational Services
- VectorVest OnLine
- VectorVest Options Analyzer
- VectorVest ProGraphics v6.0
- VectorVest ProTrader 7
- VectorVest RealTime Derby Tool
- VectorVest Simulator
- VectorVest Variator
- VectorVest Watchdog
