

HOT TOPICS LIST
- MACD
- Fibonacci
- RSI
- Gann
- ADXR
- Stochastics
- Volume
- Triangles
- Futures
- Cycles
- Volatility
- ZIGZAG
- MESA
- Retracement
- Aroon
INDICATORS LIST
LIST OF TOPICS
PRINT THIS ARTICLE
by Donald W. Pendergast, Jr.
Shares of Procter & Gamble appear to be close to the termination point of their latest four-month rally.
Position: N/A
Donald W. Pendergast, Jr.
Freelance financial markets writer and online publisher of the Trendzetterz.com S&P 500 Weekly Forecast service.
PRINT THIS ARTICLE
ELLIOTT WAVE
Procter And Gamble Rally Approaching Its End?
10/30/12 09:44:54 AMby Donald W. Pendergast, Jr.
Shares of Procter & Gamble appear to be close to the termination point of their latest four-month rally.
Position: N/A
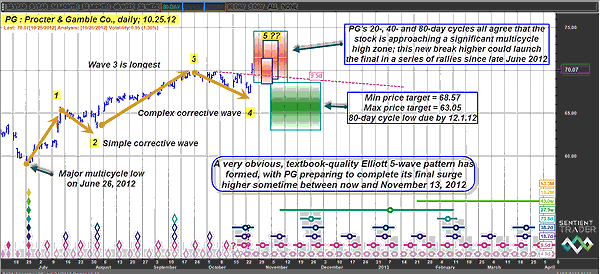
| Many stocks in the broad market tend to make major multicycle lows at around the same time, and shares of Procter & Gamble (PG) are no exception, having made a major swing low back on June 26, 2012. Not surprisingly, the stock has also enjoyed a steady bullish run since then, rising by nearly 20% as of Thursday, October 25, 2012. However, cycles and money flow analysis reveal that PG may soon be vulnerable to a proportional correction and/or trend reversal. Here's a closer look now. See Figure 1. |
|
| FIGURE 1: PG, DAILY. The combined power of price cycle and Elliott wave analysis is easily observed here on this daily chart of Procter & Gamble. Note the near-perfect form of the ongoing five-wave Elliott pattern. |
| Graphic provided by: Sentient Trader. |
| |
| When no less than eight separate price cycles all bottom together, you can be pretty sure that a major swing low is in place and that some sort of a tradable rally will ensue in its wake. That's just what happened in the case of PG as cycles ranging from five days to 18 months all bottomed simultaneously. As the trend gathered momentum, long-term money flow (based on the 100-day Chaikin money flow (CMF)(100) histogram) also turned positive and is now at the highest level since March 2012. There is a slight negative price/money flow divergence apparent, however, and the absolute level of the money flow histogram is at an unsustainable level. |
|
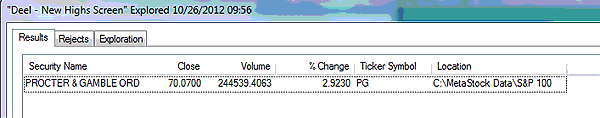
| FIGURE 2: BREAKOUT. The only .OEX component making a price and volume breakout for Thursday, October 25, 2012, is Procter & Gamble. |
| Graphic provided by: MetaStock. |
| Graphic provided by: MetaStock Explorer. |
| |
| One of the most fascinating technical features of PG's four-month rally is that it has unfolded in a near-perfect five-wave Elliott pattern -- even the two corrective waves (waves 2 and 4) follow Elliott guidelines regarding the theory of alternation, which says that in a valid five-wave pattern, if wave 2 is a simple correction then wave 4 should appear as complex, multiswing correction (similarly, if wave 2 is a complex correction, then wave 4 should appear as a simple correction). The third wave of the pattern is also the longest wave and wave 4 did not drop below the lowest point of wave 2, also fulfilling Elliott's rules. What a pattern -- Elliotticians are surely abuzz about this one, and with the added benefit of money flow and cycles analysis applied to the pattern, we can come up with some amazing price projections for PG's newly formed fifth wave. |
| A look at PG's cycle studies shows us that the stock's 20-, 40-, and 80-day price cycles are all due to peak within the window between October 26 and November 13, 2012 (see red time/price projection zone), and Thursday's powerful price/volume breakout in PG has decisively launched the stock into its fifth and final wave higher of the current rally off the late June 2012 lows. See Figure 2. Given that long-term money flow is at an unsustainable level and that some bearish divergence with price is already manifesting, it could be a great time for current PG longs to tighten stops or to begin taking some profits. Once wave 5 finally peaks, it will be time to start looking for suitable mechanical sell signals that can help you construct a short swing or long put trade; the green time/price (TP) projection box shows us where PG's 80-day cycle low is expected to occur, so you may be able to find numerous shorting or speculative put purchase opportunities during PG anticipated correction. After a major five-wave advance there is normally a noticeable A-B-C corrective wave structure that unfolds. Watch as the waves unfold as PG descends into the green TP zone for additional clues as to the actual form and symmetry of the entire Elliott pattern. As always, risk no more than 2% of your account balance on any stock, ETF, forex or futures trade that you make and remember to trade wisely until we meet here again. |
Freelance financial markets writer and online publisher of the Trendzetterz.com S&P 500 Weekly Forecast service.
| Title: | Market consultant and writer |
| Company: | Trendzetterz |
| Address: | 81 Hickory Hollow Drive |
| Crossville, TN 38555 | |
| Phone # for sales: | 904-303-4814 |
| Website: | trendzetterz.com |
| E-mail address: | support@trendzetterz.com |
Traders' Resource Links | |
| Trendzetterz has not added any product or service information to TRADERS' RESOURCE. | |
Click here for more information about our publications!
PRINT THIS ARTICLE

Request Information From Our Sponsors
- StockCharts.com, Inc.
- Candle Patterns
- Candlestick Charting Explained
- Intermarket Technical Analysis
- John Murphy on Chart Analysis
- John Murphy's Chart Pattern Recognition
- John Murphy's Market Message
- MurphyExplainsMarketAnalysis-Intermarket Analysis
- MurphyExplainsMarketAnalysis-Visual Analysis
- StockCharts.com
- Technical Analysis of the Financial Markets
- The Visual Investor
- VectorVest, Inc.
- Executive Premier Workshop
- One-Day Options Course
- OptionsPro
- Retirement Income Workshop
- Sure-Fire Trading Systems (VectorVest, Inc.)
- Trading as a Business Workshop
- VectorVest 7 EOD
- VectorVest 7 RealTime/IntraDay
- VectorVest AutoTester
- VectorVest Educational Services
- VectorVest OnLine
- VectorVest Options Analyzer
- VectorVest ProGraphics v6.0
- VectorVest ProTrader 7
- VectorVest RealTime Derby Tool
- VectorVest Simulator
- VectorVest Variator
- VectorVest Watchdog