HOT TOPICS LIST
- MACD
- Fibonacci
- RSI
- Gann
- ADXR
- Stochastics
- Volume
- Triangles
- Futures
- Cycles
- Volatility
- ZIGZAG
- MESA
- Retracement
- Aroon
INDICATORS LIST
LIST OF TOPICS
PRINT THIS ARTICLE
by David Penn
After a May breakout and rally, a top has developed in the New Zealand dollar in June and July.
Position: N/A
David Penn
Technical Writer for Technical Analysis of STOCKS & COMMODITIES magazine, Working-Money.com, and Traders.com Advantage.
PRINT THIS ARTICLE
HEAD & SHOULDERS
A Head and Shoulders Kiwi
07/18/02 07:50:42 AMby David Penn
After a May breakout and rally, a top has developed in the New Zealand dollar in June and July.
Position: N/A
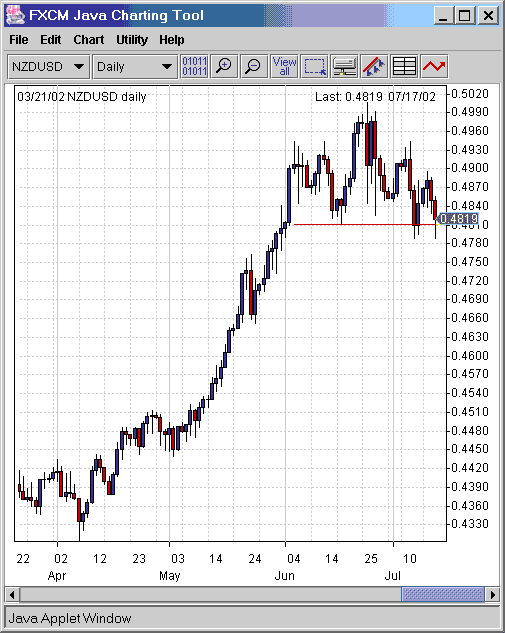
| Those looking for rally signs in the U.S. financial markets may be able to take heart from the Land Down Under. Or, at least, from the island neighbor of the Land Down Under: New Zealand. The New Zealand dollar, or "kiwi" as it is colloquially known, has been a part of the beat the dollar rally that most foreign currencies have been participating in for much of 2002. The NZDUSD (New Zealand dollar/U.S. dollar) broke out of its base in mid-May with a new high at 0.4570. A month later, in mid-June, the NZDUSD was at 0.4970, a gain of 400 pips, or $4,000 per 100K units traded. Not bad for a month's worth of work. |
| But it appears as if the rally days for the New Zealand dollar may be done for the time being. This is because the May-June rally in the NZDUSD looks to be turning into a head and shoulders top as June ends and July begins. Head and shoulders tops are among the most readily recognized chart formations, with their lower peak-higher peak-lower peak price action and horizontal (often) support at the correction lows between the initial peak and the higher peak (the left shoulder and the head) and between the higher peak and the subsequent, usually lower peak (the head and the right shoulder). |

|
| This head and shoulders top in NZDUSD suggests that the rally in the "kiwi" has come to an end. |
| Graphic provided by: FXCM Java Charting Tool. |
| |
| What does this suggest for the NZDUSD? The measurement rule for head and shoulders tops subtracts the value of the formation height from the value at the "neckline," where the correction lows in between peaks establishes support. In this case, a formation size of 160 pips subtracted from the neckline of 0.4830 provides for a minimum downside target of 0.4670. A correction to this area would represent a test of the mid-May correction low of 0.4660. A 160 pip move, based on 100K unit trades, is equal to about $1,600 USD. |
Technical Writer for Technical Analysis of STOCKS & COMMODITIES magazine, Working-Money.com, and Traders.com Advantage.
| Title: | Technical Writer |
| Company: | Technical Analysis, Inc. |
| Address: | 4757 California Avenue SW |
| Seattle, WA 98116 | |
| Phone # for sales: | 206 938 0570 |
| Fax: | 206 938 1307 |
| Website: | www.Traders.com |
| E-mail address: | DPenn@traders.com |
Traders' Resource Links | |
| Charting the Stock Market: The Wyckoff Method -- Books | |
| Working-Money.com -- Online Trading Services | |
| Traders.com Advantage -- Online Trading Services | |
| Technical Analysis of Stocks & Commodities -- Publications and Newsletters | |
| Working Money, at Working-Money.com -- Publications and Newsletters | |
| Traders.com Advantage -- Publications and Newsletters | |
| Professional Traders Starter Kit -- Software | |
Click here for more information about our publications!
PRINT THIS ARTICLE

Request Information From Our Sponsors
- StockCharts.com, Inc.
- Candle Patterns
- Candlestick Charting Explained
- Intermarket Technical Analysis
- John Murphy on Chart Analysis
- John Murphy's Chart Pattern Recognition
- John Murphy's Market Message
- MurphyExplainsMarketAnalysis-Intermarket Analysis
- MurphyExplainsMarketAnalysis-Visual Analysis
- StockCharts.com
- Technical Analysis of the Financial Markets
- The Visual Investor
- VectorVest, Inc.
- Executive Premier Workshop
- One-Day Options Course
- OptionsPro
- Retirement Income Workshop
- Sure-Fire Trading Systems (VectorVest, Inc.)
- Trading as a Business Workshop
- VectorVest 7 EOD
- VectorVest 7 RealTime/IntraDay
- VectorVest AutoTester
- VectorVest Educational Services
- VectorVest OnLine
- VectorVest Options Analyzer
- VectorVest ProGraphics v6.0
- VectorVest ProTrader 7
- VectorVest RealTime Derby Tool
- VectorVest Simulator
- VectorVest Variator
- VectorVest Watchdog
