HOT TOPICS LIST
- MACD
- Fibonacci
- RSI
- Gann
- ADXR
- Stochastics
- Volume
- Triangles
- Futures
- Cycles
- Volatility
- ZIGZAG
- MESA
- Retracement
- Aroon
INDICATORS LIST
LIST OF TOPICS
PRINT THIS ARTICLE
by Chaitali Mohile
Flowserve Corp. has entered a tricky trading range. Will it undergo a bullish breakout?
Position: N/A
Chaitali Mohile
Active trader in the Indian stock markets since 2003 and a full-time writer. Trading is largely based upon technical analysis.
PRINT THIS ARTICLE
BREAKOUTS
Flowserve Corp. Hits Resistance
10/29/12 12:51:20 PMby Chaitali Mohile
Flowserve Corp. has entered a tricky trading range. Will it undergo a bullish breakout?
Position: N/A
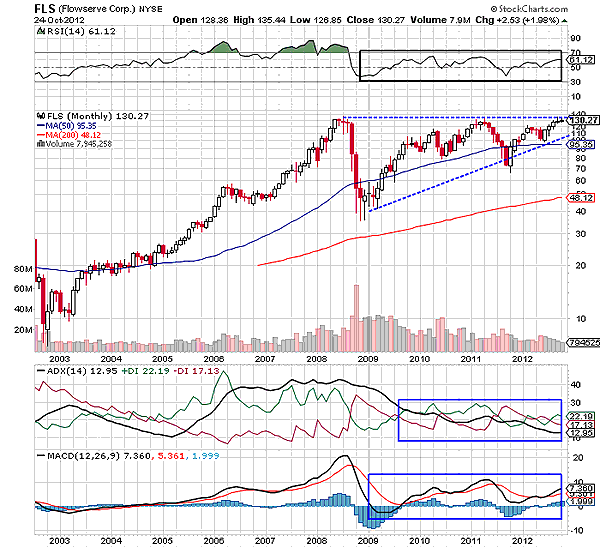
| An ascending triangle is a bullish reversal formation in a downtrend and a continuation pattern if appearing in an uptrend. Flowserve Corp. (FLS) has formed an ascending triangle on the monthly time frame chart in Figure 1. The stock was in a complete bullish frame from 2003 to 2009. As the stock hit a new high at 140 levels, it formed a cluster of doji candlesticks, suggesting a top formation. |
| The relative strength index (RSI) (14) formed a triple top in an overbought zone, the average directional index (ADX) (14) showed an overheated uptrend, and the moving average convergence/divergence (MACD) (12,26,9) plunged from positive territory. These conditions strengthened the bears in FLS, resulting in a corrective rally. However, the stock immediately established support marginally below the 50-day moving average (MA) and initiated a fresh pullback rally. |
| Thereafter, FLS formed a series of higher lows and a stable high, forming an ascending triangle. Here, the triangle is formed after the extended bullish rally; therefore, we can anticipate this formation as a bullish continuation pattern. During the formation of the triangle, the uptrend was very weak. Later, the trend slipped below 20 levels, indicating bullish consolidation. The RSI (14) was stuck in between 50 and 70 levels. The moving average convergence/divergence (MACD) (12,26,9) turned volatile in positive territory (above a zero line). As a result, FLS steadily formed an ascending triangle. The two converging trendlines of the triangle has narrowed the trading range of the stock. |

|
| FIGURE 1: FLS, MONTHLY |
| Graphic provided by: StockCharts.com. |
| |
| Currently, the triangle is getting ready to break in an upward direction. This breakout would be a major event for FLS, opening a low-risk buying opportunity for traders. However, developing a fresh uptrend will be the most important factor for a steady breakout. |

|
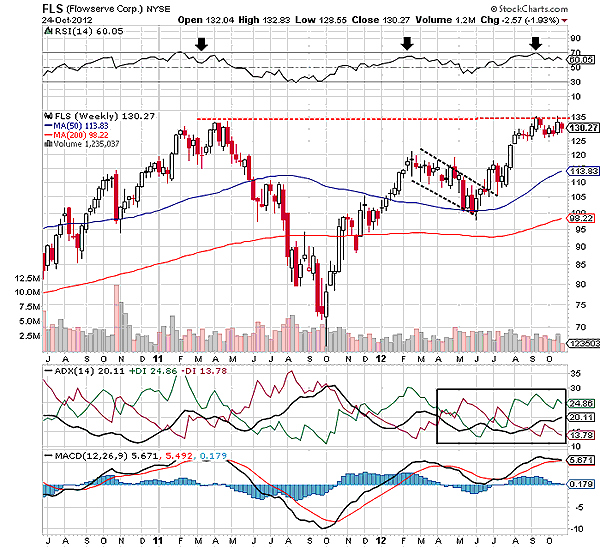
| FIGURE 2: FLS, WEEKLY |
| Graphic provided by: StockCharts.com. |
| |
| In Figure 2, FLS has reached previous high resistance at 135 levels. Although the uptrend is developing, the stock is consolidating at the top. The reluctant RSI (14) can be one of the reasons for this horizontal price action. The MACD (12,26,9) is shaky in positive territory. Therefore, all the three indicators are not completely bullish to support a fresh bullish breakout. But as these oscillators are in a bullish zone, the stock would sustain at current levels in the price chart. The stock would continue to consolidate till all the indicators turned healthily bullish. Since 2011, the RSI (14) has failed to surge above 70 levels, and therefore, the indicator has to breach this psychological resistance to generate fresh bullish strength in the rally. This would definitely enhance the possibility of a successful breakout in the future. |
Active trader in the Indian stock markets since 2003 and a full-time writer. Trading is largely based upon technical analysis.
| Company: | Independent |
| Address: | C1/3 Parth Indraprasth Towers. Vastrapur |
| Ahmedabad, Guj 380015 | |
| E-mail address: | chaitalimohile@yahoo.co.in |
Traders' Resource Links | |
| Independent has not added any product or service information to TRADERS' RESOURCE. | |
Click here for more information about our publications!
PRINT THIS ARTICLE

Request Information From Our Sponsors
- StockCharts.com, Inc.
- Candle Patterns
- Candlestick Charting Explained
- Intermarket Technical Analysis
- John Murphy on Chart Analysis
- John Murphy's Chart Pattern Recognition
- John Murphy's Market Message
- MurphyExplainsMarketAnalysis-Intermarket Analysis
- MurphyExplainsMarketAnalysis-Visual Analysis
- StockCharts.com
- Technical Analysis of the Financial Markets
- The Visual Investor
- VectorVest, Inc.
- Executive Premier Workshop
- One-Day Options Course
- OptionsPro
- Retirement Income Workshop
- Sure-Fire Trading Systems (VectorVest, Inc.)
- Trading as a Business Workshop
- VectorVest 7 EOD
- VectorVest 7 RealTime/IntraDay
- VectorVest AutoTester
- VectorVest Educational Services
- VectorVest OnLine
- VectorVest Options Analyzer
- VectorVest ProGraphics v6.0
- VectorVest ProTrader 7
- VectorVest RealTime Derby Tool
- VectorVest Simulator
- VectorVest Variator
- VectorVest Watchdog
