HOT TOPICS LIST
- MACD
- Fibonacci
- RSI
- Gann
- ADXR
- Stochastics
- Volume
- Triangles
- Futures
- Cycles
- Volatility
- ZIGZAG
- MESA
- Retracement
- Aroon
INDICATORS LIST
LIST OF TOPICS
PRINT THIS ARTICLE
by Koos van der Merwe
The share price of a double top is characterized by two peaks.
Position: Sell
Koos van der Merwe
Has been a technical analyst since 1969, and has worked as a futures and options trader with First Financial Futures in Johannesburg, South Africa.
PRINT THIS ARTICLE
DOUBLE TOPS
A Double Top For Dollarama
10/25/12 01:17:52 PMby Koos van der Merwe
The share price of a double top is characterized by two peaks.
Position: Sell
| During the formation of a double top, we might feel that the formation could be the start of a head & shoulder formation. But when the price falls below the previous trough -- a pattern that does not happen with a head & shoulder formation -- a sell signal is triggered. |

|
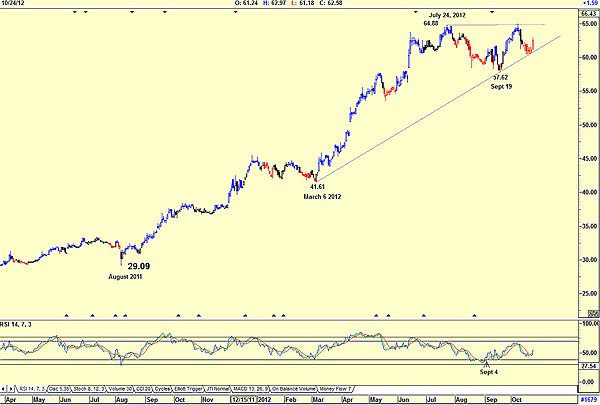
| FIGURE 1: DOL, DAILY |
| Graphic provided by: AdvancedGET. |
| |
| The chart of Dollarama (DOL) in Figure 1 shows how the share price of DOL has risen extremely well from a low of $29.09 in August 2011 to a high of $64.88 by July 24, 2012. The share price then dropped to $57.62 by September 19 before rising to retest the high of $64.88 and forming what looks like the double top. However, a double top will be confirmed only when the price falls below the previous trough. In other words, the double top is only confirmed should the price fall below the $57.62 level: the trough. Until then, the formation could be that of a developing head & shoulder pattern even though the head may not be higher than the left shoulder. Drawing a support line from the low of March 6, 2012, we see that the price found support on that trendline. A move below it could be a significant sell signal. The relative strength index (RSI) did give a buy signal on September 4 and although it corrected, it did not give a definite sell signal. |

|
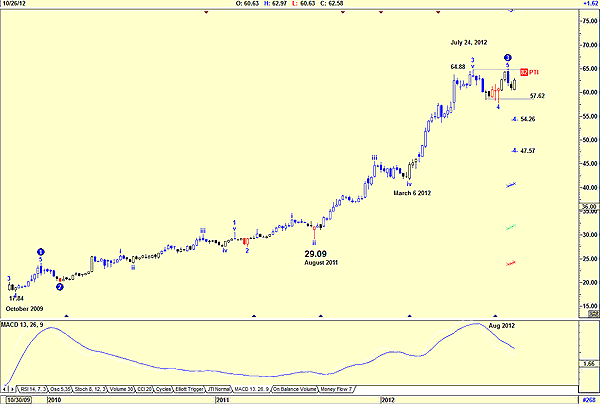
| FIGURE 2: DOL, WEEKLY |
| Graphic provided by: AdvancedGET. |
| |
| The weekly chart in Figure 2 shows how the price has risen from a low of $17.84 in October 2009 in an Elliott wave count that is suggesting the price has completed a wave 3 and is now in the process of forming a wave 4 with a possible target of $54.26 or $47.57. With a probability index (PTI) of 82, the likelihood of this happening is very likely. The moving average convergence/divergence (MACD) did give a sell in August 2012 and is still showing weakness. I would not be a buyer of DOL at present levels. I would prefer waiting until wave 4 has been completed, or when the MACD gives a buy signal. I shall reexamine the Elliott wave count in a weekly chart to determine whether a wave 5 up has started or there has been a break above $64.88 on the daily chart. |
Has been a technical analyst since 1969, and has worked as a futures and options trader with First Financial Futures in Johannesburg, South Africa.
| Address: | 3256 West 24th Ave |
| Vancouver, BC | |
| Phone # for sales: | 6042634214 |
| E-mail address: | petroosp@gmail.com |
Click here for more information about our publications!
PRINT THIS ARTICLE

Request Information From Our Sponsors
- VectorVest, Inc.
- Executive Premier Workshop
- One-Day Options Course
- OptionsPro
- Retirement Income Workshop
- Sure-Fire Trading Systems (VectorVest, Inc.)
- Trading as a Business Workshop
- VectorVest 7 EOD
- VectorVest 7 RealTime/IntraDay
- VectorVest AutoTester
- VectorVest Educational Services
- VectorVest OnLine
- VectorVest Options Analyzer
- VectorVest ProGraphics v6.0
- VectorVest ProTrader 7
- VectorVest RealTime Derby Tool
- VectorVest Simulator
- VectorVest Variator
- VectorVest Watchdog
- StockCharts.com, Inc.
- Candle Patterns
- Candlestick Charting Explained
- Intermarket Technical Analysis
- John Murphy on Chart Analysis
- John Murphy's Chart Pattern Recognition
- John Murphy's Market Message
- MurphyExplainsMarketAnalysis-Intermarket Analysis
- MurphyExplainsMarketAnalysis-Visual Analysis
- StockCharts.com
- Technical Analysis of the Financial Markets
- The Visual Investor
