HOT TOPICS LIST
- MACD
- Fibonacci
- RSI
- Gann
- ADXR
- Stochastics
- Volume
- Triangles
- Futures
- Cycles
- Volatility
- ZIGZAG
- MESA
- Retracement
- Aroon
INDICATORS LIST
LIST OF TOPICS
PRINT THIS ARTICLE
by Billy Williams
At a glance, the market looks like it's having just another pullback, but in fact, it is reaching a potential impasse that could reverse its current trend.
Position: Sell
Billy Williams
Billy Williams has been trading the markets for 27 years, specializing in momentum trading with stocks and options.
PRINT THIS ARTICLE
STRATEGIES
The Market At A Critical Impasse, And Those Rising Wedges
10/25/12 12:39:53 PMby Billy Williams
At a glance, the market looks like it's having just another pullback, but in fact, it is reaching a potential impasse that could reverse its current trend.
Position: Sell
| Just like an old sea captain who has sailed in violent storms but is able to draw from a deep well of hard-fought experience that allows him to stay afloat, a skilled trader can draw from the tools that he has acquired through long experience. This way, he can discern that there is trouble brewing in the marketplace that can cause less-experienced traders to be knocked off-course. Up close, it appears that the market is firmly in the bull's camp and, though it has been pulling back, trader sentiment appears positive. But by scaling up on the time frame, you can start to see a storm forming on the horizon as a reversal pattern may be forming and a critical impasse may present itself to the bulls that may take away the gains they have fought for. |

|
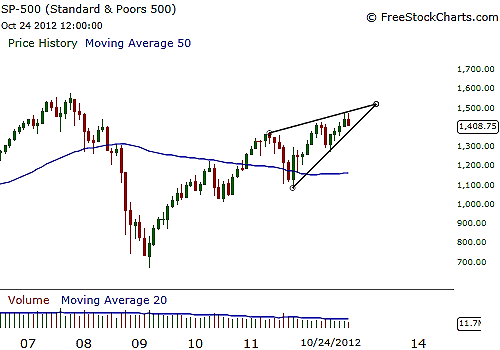
| FIGURE 1: SPX, MONTHLY. A bearish rising wedge pattern has formed, which could cause price to turn over in the bear's favor. |
| Graphic provided by: www.freestockcharts.com. |
| |
| Go to any price chart and look at the monthly chart, and it appears that price is tightening on its latest ascent. For a beginner or an intermediate-level trader, it doesn't appear to be much, but for an experienced chartist, a red flag is signaling a call for caution. A bearish rising wedge pattern is forming on the monthly chart (Figure 1), revealing that a reversal pattern is developing that could result in the market finishing lower for the year. If that happens, the results will be catastrophic for those who had hoped that QE3 would lift the market. |

|
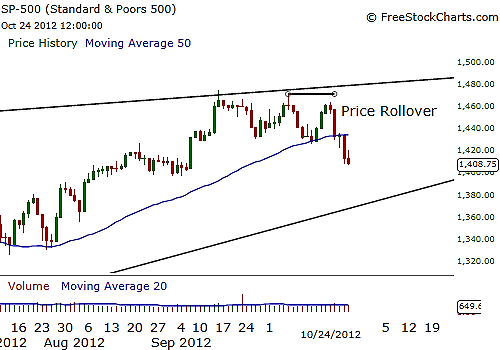
| FIGURE 2: SPX, DAILY. On the daily chart, price failed to go higher and rolled over to the downside. If it continues to trade lower, through the lower trendline of the bearish rising wedge pattern, then there could be a sharp and explosive move as the bears pile on and tear away control from the bulls. |
| Graphic provided by: www.freestockcharts.com. |
| |
| A bearish rising wedge forms by bouncing between two converging, upsloping trendlines until it breaks out to the downside on heavy volume. The pattern combines similar characteristics of the upsloping price action of a bear flag pattern with the back-and-forth price action of a symmetrical triangle. These types of reversal formations can take up to three months to form, but need a minimum duration of three weeks. See Figure 2. The success rate can be an average of 76% but can be as high as 94% if you wait for the downside breakout on heavy volume. Volume tends to decrease during the formation of the pattern but experiences some volume spikes during false breakouts. This is a critical distinction because only 38% of the breakouts actually require higher volume, which makes this a high-probability pattern to trade off of. |

|
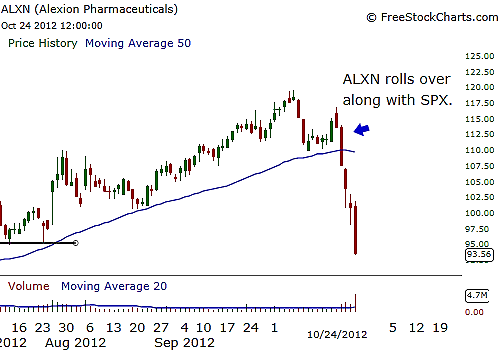
| FIGURE 3: ALXN. Stock leaders like ALXN seem to be mimicking the SPX's price action and appears to be breaking downward. |
| Graphic provided by: www.freestockcharts.com. |
| |
| While you can play the SPX using this pattern, you might also want to look for other stock leaders that have mirrored the index's price action or experienced a plurality of patterns, which means that a stock's price action will mimic the price movement of the SPX. See Figure 3. |
| This is common, as 70% to 80% of stocks will move in tandem with the overall market and can give you a vast number of trades to take if the Standard & Poor's 500 (SPX) reverses off the rising wedge pattern and moves lower. If it does, the movement will be sharp and explosive, so it might be a good idea to use put options or some type of bearish income spread strategy. However, using put options alone, you might be advised to trade options near or slightly out-of-the-money with a high delta reading of 0.80 or greater and with at least 30 days of time left till expiration. |
Billy Williams has been trading the markets for 27 years, specializing in momentum trading with stocks and options.
| Company: | StockOptionSystem.com |
| E-mail address: | stockoptionsystem.com@gmail.com |
Traders' Resource Links | |
| StockOptionSystem.com has not added any product or service information to TRADERS' RESOURCE. | |
Click here for more information about our publications!
PRINT THIS ARTICLE

|

Request Information From Our Sponsors
- StockCharts.com, Inc.
- Candle Patterns
- Candlestick Charting Explained
- Intermarket Technical Analysis
- John Murphy on Chart Analysis
- John Murphy's Chart Pattern Recognition
- John Murphy's Market Message
- MurphyExplainsMarketAnalysis-Intermarket Analysis
- MurphyExplainsMarketAnalysis-Visual Analysis
- StockCharts.com
- Technical Analysis of the Financial Markets
- The Visual Investor
- VectorVest, Inc.
- Executive Premier Workshop
- One-Day Options Course
- OptionsPro
- Retirement Income Workshop
- Sure-Fire Trading Systems (VectorVest, Inc.)
- Trading as a Business Workshop
- VectorVest 7 EOD
- VectorVest 7 RealTime/IntraDay
- VectorVest AutoTester
- VectorVest Educational Services
- VectorVest OnLine
- VectorVest Options Analyzer
- VectorVest ProGraphics v6.0
- VectorVest ProTrader 7
- VectorVest RealTime Derby Tool
- VectorVest Simulator
- VectorVest Variator
- VectorVest Watchdog
