HOT TOPICS LIST
- MACD
- Fibonacci
- RSI
- Gann
- ADXR
- Stochastics
- Volume
- Triangles
- Futures
- Cycles
- Volatility
- ZIGZAG
- MESA
- Retracement
- Aroon
INDICATORS LIST
LIST OF TOPICS
PRINT THIS ARTICLE
by Donald W. Pendergast, Jr.
Shares of Halliburton, Inc., enjoyed a solid rise from late June until mid-September 2012, but the second stage of a proportional correction is already under way.
Position: N/A
Donald W. Pendergast, Jr.
Freelance financial markets writer and online publisher of the Trendzetterz.com S&P 500 Weekly Forecast service.
PRINT THIS ARTICLE
CYCLES
HAL 40-Day Cycle Low By Mid-November?
10/25/12 10:35:23 AMby Donald W. Pendergast, Jr.
Shares of Halliburton, Inc., enjoyed a solid rise from late June until mid-September 2012, but the second stage of a proportional correction is already under way.
Position: N/A
| Energy sector stocks, particularly energy services industry group issues, have always been among the most volatile, steadily trending equities of all, only exceeded by those found in the gold/silver mining industry. Halliburton Co. (HAL) is one of the better-known names in this group, and the stock appears to be on a fast track toward completing a significant 40- and 80-day cycle low sometime within the next three weeks. Here's a closer look now. |

|
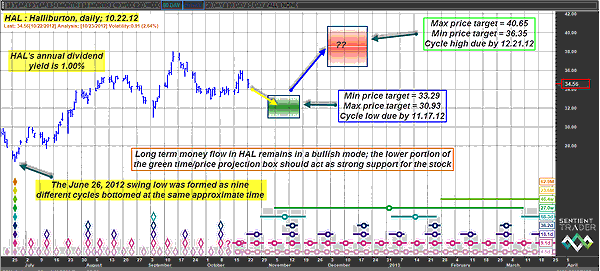
| FIGURE 1: HAL, DAILY. With HAL's long-term money flow still in bullish territory, any decline by the stock into the lower portion of the green time/price projection zone might form the basis for a low-risk long entry. |
| Graphic provided by: Sentient Trader. |
| |
| June 26, 2012 was a date of major technical importance for HAL. After all, it's not every trading day that nine separate price cycles all converge to confirm that a large-cap stock has made a major multicycle low, and that's exactly what occurred in this stock about four months ago (Figure 1). Not surprisingly, HAL experienced a fairly substantial rally after all of those cycles bottomed together, rising from a low of 26.28 all the way to 38.00 less than three months later on September 14, 2012 -- an eventual gain of more than 44%, which is very healthy for any large-cap stock, regardless of which sector from which it hails. Examination of HAL's 100-day Chaikin money flow (CMF)(100) reveals that there is still plenty of bullish interest in the stock, with no sign yet of any negative price momentum divergence. While that's good news for energy stock bulls, analysis of HAL's 40- and 80-day price cycles shows us that the stock is likely already well on its way toward completing a significant multicycle low sometime between November 1 and November 17, 2012. See Figure 2. The green time/price projection box on the chart highlights the anticipated time and price range window for this expected low, with the minimum target price being 33.29 and the maximum target price coming in at 30.93. Note that the lower boundary of the green box is at approximately the same price level as the September 4, 2012, swing low, which happened to be formed by the bottoming of no less than five separate price cycles, including the nominal 40- and 80-day cycles. That swing low support zone at 31.00 is sure to be a significant area of support, one that could help propel HAL back up toward its next anticipated 40-day cycle high zone (the red time/price projection box). |

|
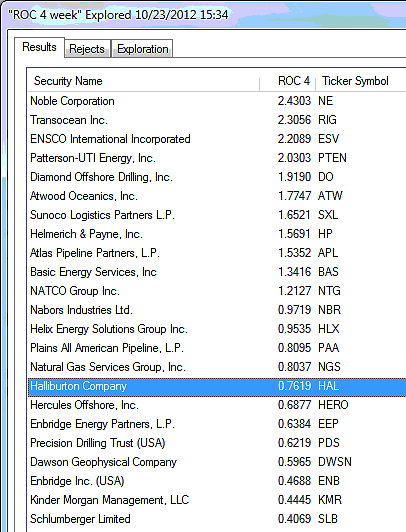
| FIGURE 2: RELATIVE STRENGTH RANKING. The four-week relative strength ranking of the strongest oil services industry group stocks versus the .SPX as of October 22, 2012. |
| Graphic provided by: MetaStock. |
| Graphic provided by: MetaStock Explorer. |
| |
| The next 40-day cycle high for HAL is expected to pull the stock back up into the mid-$30 to low $40 range sometime between December 1 and December 21, 2012, and if HAL's long-term money flow trend is still in the bullish zone (above its zero line) once it bottoms in the green zone, the odds are very good that the stock will make a strong rebound, potentially rewarding HAL bulls with some extra Christmas spending money in their trading accounts. While it may be too late to short HAL now, it's not too early to start looking for a mechanical reversal/buy signal if HAL can manage to put in a solid low near 31.00 sometime in the next couple of weeks and then start to rise again. Investigate a near-term covered-call play at that time, using slightly in-the-money calls and a 21-day exponential moving average (EMA) as the trailing stop for the entire long HAL stock/option position. If you see crude oil stage a sharp short-covering rally as HAL rebounds higher from the 31.00 area, then you have a solid foundation for this kind of near-term covered-call play. Risk 2% or less of your account value if you decide to pounce on this potential for a long setup and remember to trade wisely until we meet here again. |
Freelance financial markets writer and online publisher of the Trendzetterz.com S&P 500 Weekly Forecast service.
| Title: | Market consultant and writer |
| Company: | Trendzetterz |
| Address: | 81 Hickory Hollow Drive |
| Crossville, TN 38555 | |
| Phone # for sales: | 904-303-4814 |
| Website: | trendzetterz.com |
| E-mail address: | support@trendzetterz.com |
Traders' Resource Links | |
| Trendzetterz has not added any product or service information to TRADERS' RESOURCE. | |
Click here for more information about our publications!
Comments

Request Information From Our Sponsors
- StockCharts.com, Inc.
- Candle Patterns
- Candlestick Charting Explained
- Intermarket Technical Analysis
- John Murphy on Chart Analysis
- John Murphy's Chart Pattern Recognition
- John Murphy's Market Message
- MurphyExplainsMarketAnalysis-Intermarket Analysis
- MurphyExplainsMarketAnalysis-Visual Analysis
- StockCharts.com
- Technical Analysis of the Financial Markets
- The Visual Investor
- VectorVest, Inc.
- Executive Premier Workshop
- One-Day Options Course
- OptionsPro
- Retirement Income Workshop
- Sure-Fire Trading Systems (VectorVest, Inc.)
- Trading as a Business Workshop
- VectorVest 7 EOD
- VectorVest 7 RealTime/IntraDay
- VectorVest AutoTester
- VectorVest Educational Services
- VectorVest OnLine
- VectorVest Options Analyzer
- VectorVest ProGraphics v6.0
- VectorVest ProTrader 7
- VectorVest RealTime Derby Tool
- VectorVest Simulator
- VectorVest Variator
- VectorVest Watchdog
