HOT TOPICS LIST
- MACD
- Fibonacci
- RSI
- Gann
- ADXR
- Stochastics
- Volume
- Triangles
- Futures
- Cycles
- Volatility
- ZIGZAG
- MESA
- Retracement
- Aroon
INDICATORS LIST
LIST OF TOPICS
PRINT THIS ARTICLE
by Koos van der Merwe
There are many bears out there. To what extent are they justified in their viewpoint?
Position: Sell
Koos van der Merwe
Has been a technical analyst since 1969, and has worked as a futures and options trader with First Financial Futures in Johannesburg, South Africa.
PRINT THIS ARTICLE
ELLIOTT WAVE
Another Look At The S&P 500
10/24/12 08:24:04 AMby Koos van der Merwe
There are many bears out there. To what extent are they justified in their viewpoint?
Position: Sell
| The world economy is in a mess, we all know that, but a look at the economics, no matter what is said in the Presidential debates, is showing signs of strength. The stock market has shown that, and once the American election is over, no matter who wins, uncertainty about the economic situation will slowly disappear. |

|
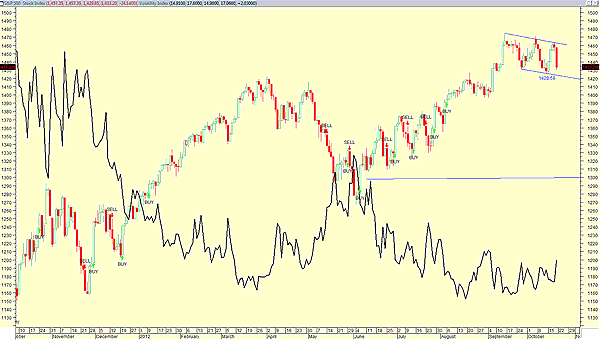
| FIGURE 1: THE S&P 500 AND THE VIX |
| Graphic provided by: MetaStock. |
| |
| Figure 1 is a chart of the Standard & Poor's 500 (SPX) with an overlay of the volatility index (VIX). As you can see from the chart, the two do act in opposition to each other. The volatility index looks like a very good indicator to forecast the future direction of the SPX. At the moment it is suggesting that the SPX could fall probably to the 1300 level should it break below the 1428.59 support level. So we now know that a correction is due. To decide how far the index will fall is suggested in Figure 2. |

|
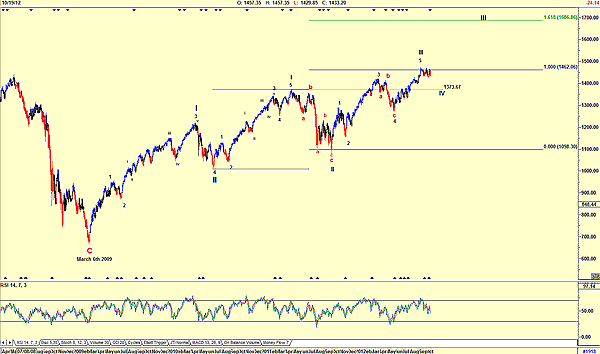
| FIGURE 2: SPX AND AN ELLIOTT WAVE COUNT |
| Graphic provided by: AdvancedGET. |
| |
| Figure 2 is a daily chart of the S&P 500 with an Elliott wave count. The first rule of the Elliott wave theory is that "the count must look right." I have spent a great deal of time deciding whether the move up from March 6, 2009, was a major wave B correction with a wave C meltdown to follow as suggested by the bears, but I cannot see that at the moment. I believe that my wave count is correct and we should now see a wave IV of wave III correction to somewhere not below 1373.67. Should this occur, the wave IV will be below the top of wave I, which is a no-no. The relative strength index (RSI), which is at the 50 level, is suggesting that this is very possible. However, should the index fall below 1373.67, then a recount of the Elliott wave count will be necessary. The Fibonacci extension on the chart does show that wave III of wave III was equal to wave I of wave III and is suggesting a target of 1686.86 as a wave III top. A great deal of uncertainty exists in the market at the moment, but with the end of that uncertainty as the Presidential election in the USA comes to an end, the index should, by all accounts, start rising strongly. At that point, the bears will shout "Hallelujah, we were right!" but the charts are suggesting, "Not for long!" |
Has been a technical analyst since 1969, and has worked as a futures and options trader with First Financial Futures in Johannesburg, South Africa.
| Address: | 3256 West 24th Ave |
| Vancouver, BC | |
| Phone # for sales: | 6042634214 |
| E-mail address: | petroosp@gmail.com |
Click here for more information about our publications!
PRINT THIS ARTICLE

Request Information From Our Sponsors
- VectorVest, Inc.
- Executive Premier Workshop
- One-Day Options Course
- OptionsPro
- Retirement Income Workshop
- Sure-Fire Trading Systems (VectorVest, Inc.)
- Trading as a Business Workshop
- VectorVest 7 EOD
- VectorVest 7 RealTime/IntraDay
- VectorVest AutoTester
- VectorVest Educational Services
- VectorVest OnLine
- VectorVest Options Analyzer
- VectorVest ProGraphics v6.0
- VectorVest ProTrader 7
- VectorVest RealTime Derby Tool
- VectorVest Simulator
- VectorVest Variator
- VectorVest Watchdog
- StockCharts.com, Inc.
- Candle Patterns
- Candlestick Charting Explained
- Intermarket Technical Analysis
- John Murphy on Chart Analysis
- John Murphy's Chart Pattern Recognition
- John Murphy's Market Message
- MurphyExplainsMarketAnalysis-Intermarket Analysis
- MurphyExplainsMarketAnalysis-Visual Analysis
- StockCharts.com
- Technical Analysis of the Financial Markets
- The Visual Investor
