HOT TOPICS LIST
- MACD
- Fibonacci
- RSI
- Gann
- ADXR
- Stochastics
- Volume
- Triangles
- Futures
- Cycles
- Volatility
- ZIGZAG
- MESA
- Retracement
- Aroon
INDICATORS LIST
LIST OF TOPICS
PRINT THIS ARTICLE
by Koos van der Merwe
When a stock moves from a low of 64 cents in October 2002 to a high of $76.24 today, then it is a share to keep watching.
Position: Sell
Koos van der Merwe
Has been a technical analyst since 1969, and has worked as a futures and options trader with First Financial Futures in Johannesburg, South Africa.
PRINT THIS ARTICLE
ELLIOTT WAVE
American Tower's Rise
10/23/12 12:44:17 PMby Koos van der Merwe
When a stock moves from a low of 64 cents in October 2002 to a high of $76.24 today, then it is a share to keep watching.
Position: Sell
| American Tower Corp. (AMT), a real estate investment trust, operates as a wireless and broadcast communications infrastructure company. It develops, owns, and operates communications sites. As of now, the company has a yield of 1.2%, nothing wonderful, so looking to the share for future growth is the way to go. |

|
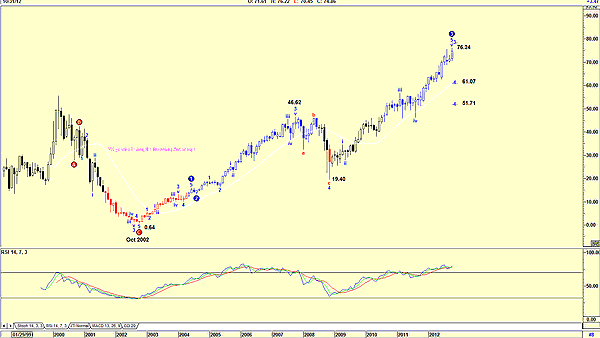
| FIGURE 1: AMT, MONTHLY. This chart of American Tower Corp. suggests a wave V top. |
| Graphic provided by: AdvancedGET. |
| |
| Figure 1 is a monthly chart and shows how the price has risen from the low of 64 cents in October 2002 to the high of $76.24 today. An Elliott wave count is suggesting that the share price has completed a wave 3 and should correct in a wave 4 to either $61.07 or $51.71. The relative strength index (RSI), which is at overbought levels, is suggesting that a correction is on the cards. |

|
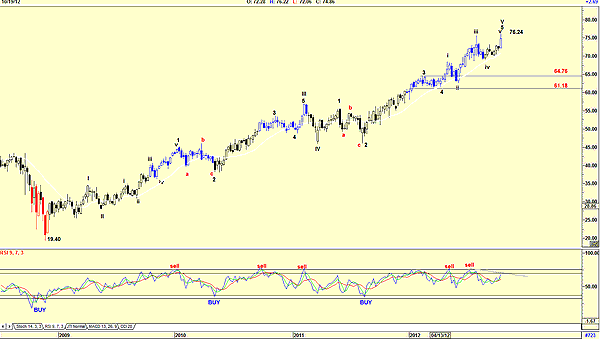
| FIGURE 2: AMT, WEEKLY. A weekly chart of American Tower Corp. suggests the target for a wave correction. |
| Graphic provided by: AdvancedGET. |
| |
| Figure 2 is a weekly chart and confirms that the stock price is completing an Elliott wave V top. When it occurs, the correction should see the price fall to the fourth wave of lesser degree, somewhere between $64.76 and $61.18. The nine-period RSI on the chart is also at overbought levels, suggesting that a correction could occur in the near future. |

|
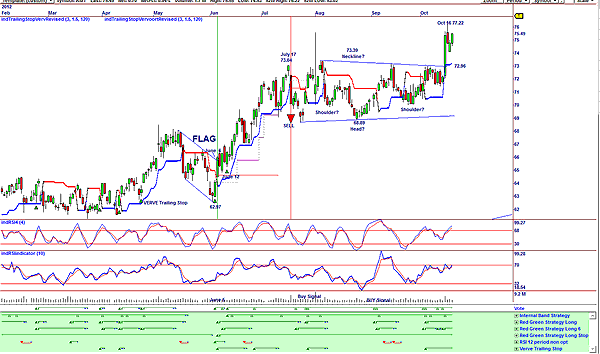
| FIGURE 3: AMT, DAILY. This chart suggests a correction in the offing. |
| Graphic provided by: OmniTrader. |
| |
| My daily chart in Figure 3 shows the flag pattern given in June 2012 with the breakout on June 6. The share price moved up strongly on a vote line buy signal. The share price moved up strongly to a high of $73.04 by July 17 and gave a trailing-stop sell signal on July 18 by breaking below the Verve trailing stop. The vote line, however, stayed in a positive mode, suggesting that we should buy on any new buy signal given. The RSI four-period indicator and the RSI 10-period indicator are both at overbought levels, suggesting weakness with a fall in price possible to the support level at $72.96. The trendlines do give the suggestion of a rather large flag pattern, but I would be hesitant to accept that. There is also the suggestion of an inverted head & shoulders pattern, with a break above the neckline being a buy signal, with a target of $77.89 (73.39 - 68.89 = 4.50 + 73.39 = 77.89), close to where the price rose on October 16. Finally, do note how volume fell as the price rose on October 18, a sign of weakness. This is a share that is on my watchlist for a buy if and when the price falls to the $72.96 level and an RSI buy or a vote line buy is given. When that occurs, I shall analyze the chart in detail to confirm a buy signal. |
Has been a technical analyst since 1969, and has worked as a futures and options trader with First Financial Futures in Johannesburg, South Africa.
| Address: | 3256 West 24th Ave |
| Vancouver, BC | |
| Phone # for sales: | 6042634214 |
| E-mail address: | petroosp@gmail.com |
Click here for more information about our publications!
PRINT THIS ARTICLE

Request Information From Our Sponsors
- StockCharts.com, Inc.
- Candle Patterns
- Candlestick Charting Explained
- Intermarket Technical Analysis
- John Murphy on Chart Analysis
- John Murphy's Chart Pattern Recognition
- John Murphy's Market Message
- MurphyExplainsMarketAnalysis-Intermarket Analysis
- MurphyExplainsMarketAnalysis-Visual Analysis
- StockCharts.com
- Technical Analysis of the Financial Markets
- The Visual Investor
- VectorVest, Inc.
- Executive Premier Workshop
- One-Day Options Course
- OptionsPro
- Retirement Income Workshop
- Sure-Fire Trading Systems (VectorVest, Inc.)
- Trading as a Business Workshop
- VectorVest 7 EOD
- VectorVest 7 RealTime/IntraDay
- VectorVest AutoTester
- VectorVest Educational Services
- VectorVest OnLine
- VectorVest Options Analyzer
- VectorVest ProGraphics v6.0
- VectorVest ProTrader 7
- VectorVest RealTime Derby Tool
- VectorVest Simulator
- VectorVest Variator
- VectorVest Watchdog
