HOT TOPICS LIST
- MACD
- Fibonacci
- RSI
- Gann
- ADXR
- Stochastics
- Volume
- Triangles
- Futures
- Cycles
- Volatility
- ZIGZAG
- MESA
- Retracement
- Aroon
INDICATORS LIST
LIST OF TOPICS
PRINT THIS ARTICLE
by Donald W. Pendergast, Jr.
Shares of Citigroup have made a new yearly high, celebrating a change in the banking giant's top brass, but its key price cycles warn of a sharp correction soon.
Position: N/A
Donald W. Pendergast, Jr.
Freelance financial markets writer and online publisher of the Trendzetterz.com S&P 500 Weekly Forecast service.
PRINT THIS ARTICLE
CYCLES
For Citigroup, A New CEO But The Same 80-Day Cycle
10/23/12 08:07:42 AMby Donald W. Pendergast, Jr.
Shares of Citigroup have made a new yearly high, celebrating a change in the banking giant's top brass, but its key price cycles warn of a sharp correction soon.
Position: N/A
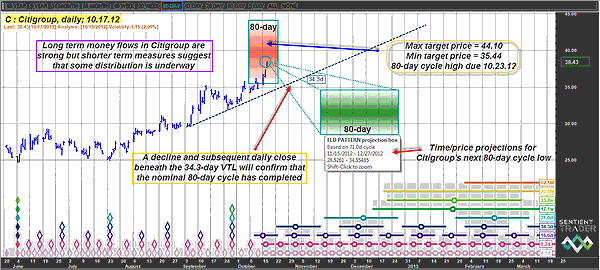
| Since completing a major multicycle on June 4, 2012, shares of Citigroup (C) have climbed by more than 56% and appear to be in strong technical and fundamental condition. However, a closer look at certain key technical dynamics reveal that the stock is rapidly approaching a time/price window in which it is expected to make a major high -- prior to a significant correction. Here's a closer look at Citigroup's daily cycles chart (Figure 1). |

|
| FIGURE 1: C, DAILY. News of a change in Citigroup's management may have sparked more buying interest in the stock in recent days, but the stock's current rise into a projected 80-day cycle high was already expected before the news release of the changes planned for the company. |
| Graphic provided by: Sentient Trader. |
| |
| When a large-cap stock makes a nearly 60% move higher in less than five months, it's bound to attract plenty of attention from Wall Street to Main Street and everywhere in between as those hungry for profits begin to come out of the woodwork, hoping for a piece of the bullish action. This may be what's happening with Citigroup shares now, and the recent announcement of major changes in the company's management may have only been the precipitating event that has helped drive the stock up close to a time/price convergence zone in which it was already anticipated to put in a major 80-day cycle peak. The large red rectangle depicts the zone in which Citigroup is most likely to make the final high of the entire June through October 2012 rally, just prior to embarking on a sizable correction sometime during November and/or December 2012. The maximum price target for the upcoming 80-day cycle high is 44.10 and the minimum target is 35.44; regardless of the actual price peak, it is expected to occur no later than October 23, 2012. Long-term money flow (as measured by the 100-day Chaikin money flow (CMF)(100)) histogram (not shown) is extremely strong now, with no sign at all of negative divergence with price, so it is entirely possibly for Citigroup to continue to climb higher within the red zone for a while longer before the anticipated correction finally hits. |

|
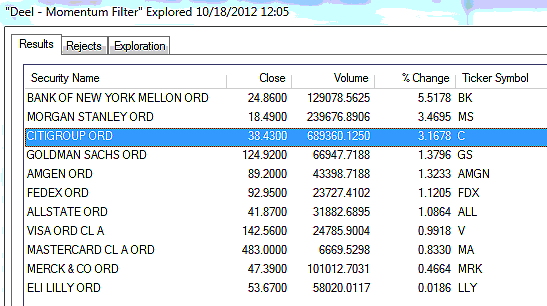
| FIGURE 2: OEX COMPONENTS. Here are the .OEX component stocks that surged higher on October 17, 2012. |
| Graphic provided by: MetaStock. |
| Graphic provided by: MetaStock Explorer. |
| |
| Once the stock falters and finally turns lower, expect the 34.3-day valid trendline (VTL) to offer some support, possibly even enabling a minor bounce or two before it finally breaks. The anticipated slide into the 80-day cycle low zone (green box) might be fast, bottoming by mid-November 2012 or it might drag on longer, finally making a major low by late December 2012. The big idea now is to protect any existing long Citigroup positions you have even as you monitor the 34.3-day VTL for a possible shorting opportunity on a breakdown. The January '13 Citigroup $39.00 puts are selling for about $2.60 and have an open interest of 817 contracts along with decent daily trading volume (see Figure 2). A fast break below the VTL toward the top of the green box near 35.00 might be an excellent profit target to hold out for with this hypothetical trade setup. As always, control your risk and trade wisely until we meet here again. |
Freelance financial markets writer and online publisher of the Trendzetterz.com S&P 500 Weekly Forecast service.
| Title: | Market consultant and writer |
| Company: | Trendzetterz |
| Address: | 81 Hickory Hollow Drive |
| Crossville, TN 38555 | |
| Phone # for sales: | 904-303-4814 |
| Website: | trendzetterz.com |
| E-mail address: | support@trendzetterz.com |
Traders' Resource Links | |
| Trendzetterz has not added any product or service information to TRADERS' RESOURCE. | |
Click here for more information about our publications!
PRINT THIS ARTICLE

Request Information From Our Sponsors
- StockCharts.com, Inc.
- Candle Patterns
- Candlestick Charting Explained
- Intermarket Technical Analysis
- John Murphy on Chart Analysis
- John Murphy's Chart Pattern Recognition
- John Murphy's Market Message
- MurphyExplainsMarketAnalysis-Intermarket Analysis
- MurphyExplainsMarketAnalysis-Visual Analysis
- StockCharts.com
- Technical Analysis of the Financial Markets
- The Visual Investor
- VectorVest, Inc.
- Executive Premier Workshop
- One-Day Options Course
- OptionsPro
- Retirement Income Workshop
- Sure-Fire Trading Systems (VectorVest, Inc.)
- Trading as a Business Workshop
- VectorVest 7 EOD
- VectorVest 7 RealTime/IntraDay
- VectorVest AutoTester
- VectorVest Educational Services
- VectorVest OnLine
- VectorVest Options Analyzer
- VectorVest ProGraphics v6.0
- VectorVest ProTrader 7
- VectorVest RealTime Derby Tool
- VectorVest Simulator
- VectorVest Variator
- VectorVest Watchdog
