HOT TOPICS LIST
- MACD
- Fibonacci
- RSI
- Gann
- ADXR
- Stochastics
- Volume
- Triangles
- Futures
- Cycles
- Volatility
- ZIGZAG
- MESA
- Retracement
- Aroon
INDICATORS LIST
LIST OF TOPICS
PRINT THIS ARTICLE
by Chaitali Mohile
Peabody Energy Corp. is likely to undergo a major trend reversal breakout.
Position: Buy
Chaitali Mohile
Active trader in the Indian stock markets since 2003 and a full-time writer. Trading is largely based upon technical analysis.
PRINT THIS ARTICLE
BREAKOUTS
BTU Breakout
10/19/12 09:34:15 AMby Chaitali Mohile
Peabody Energy Corp. is likely to undergo a major trend reversal breakout.
Position: Buy
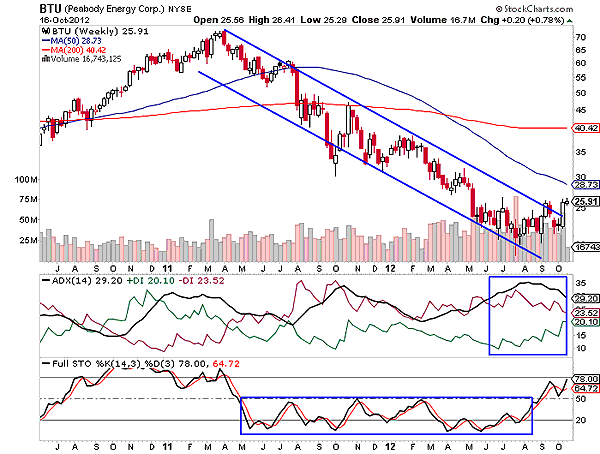
| Peabody Energy Corp (BTU) entered a long-term downtrend in early 2011. The stock declined, forming a descending channel on the weekly time frame chart in Figure 1. After breaching the 200-day moving average (MA) support, BTU entered into a serious correction. The bears strengthened as the channel moved south. We can see large red (bearish) candles in the descending channel. All the upward price actions initiated with the support of the lower trendline were very weak. Those price movements formed either smaller bullish candles or large doji candlesticks. This highlights bearish pressure in the rally. Eventually, the 50-day moving average (MA) slipped below the 200-day MA, forming a bearish moving average crossover in Figure 1. |
| The selling pressure indicated by the negative directional index (-DI) remained stronger throughout the rally. As a result, the downtrend indicated by the average directional index (ADX) (14) sustained above the 25 levels. The full stochastic (14,3,3) has been oversold for almost a year and a half. This bearish momentum steadily dragged the price rally downward. |

|
| FIGURE 1: BTU, WEEKLY |
| Graphic provided by: StockCharts.com. |
| |
| However, the indicators are likely to reverse. BTU is trying to violate the upper trendline resistance. The highly oversold oscillator has surged above the center line, entering a healthy overbought region. The ADX (14) has formed a rounded top in a well-developed trend region. If buying pressure (green line) improves drastically and surges above -DI, a fresh uptrend would develop for BTU. Although the +DI and -DI had converged earlier as well, BTU failed to develop a new uptrend. Apart from the indicator signals, the price rally should sustain above the newly formed upper trendline support. Gradually, BTU has to breach its 50-day MA resistance for the confirmed bullish breakout. |

|
| FIGURE 2: BTU, MONTHLY |
| Graphic provided by: StockCharts.com. |
| |
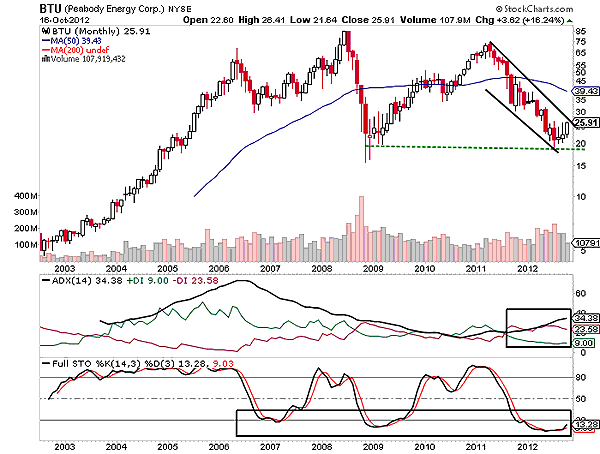
| In 2009, the stock geared up an upward rally from 20 levels, forming a robust support zone. According to Figure 2, BTU has recently hit this support level, and hence, the descending channel is likely to halt. The ADX (14) is showing the developed downtrend, but the oversold stochastic is ready to climb above 20 levels. Earlier, the oversold oscillator has recovered rapidly, giving birth to the fresh upward price rally. Similarly, it can generate a fresh bullish momentum and encourage a major bullish breakout of the descending channel. Once the breakout is confirmed, $28 would be an ideal price to trigger long positions. |
| To conclude, the long-term descending channel and the downtrend of BTU are ready to undergo a bullish reversal rally. |
Active trader in the Indian stock markets since 2003 and a full-time writer. Trading is largely based upon technical analysis.
| Company: | Independent |
| Address: | C1/3 Parth Indraprasth Towers. Vastrapur |
| Ahmedabad, Guj 380015 | |
| E-mail address: | chaitalimohile@yahoo.co.in |
Traders' Resource Links | |
| Independent has not added any product or service information to TRADERS' RESOURCE. | |
Click here for more information about our publications!
PRINT THIS ARTICLE

Request Information From Our Sponsors
- VectorVest, Inc.
- Executive Premier Workshop
- One-Day Options Course
- OptionsPro
- Retirement Income Workshop
- Sure-Fire Trading Systems (VectorVest, Inc.)
- Trading as a Business Workshop
- VectorVest 7 EOD
- VectorVest 7 RealTime/IntraDay
- VectorVest AutoTester
- VectorVest Educational Services
- VectorVest OnLine
- VectorVest Options Analyzer
- VectorVest ProGraphics v6.0
- VectorVest ProTrader 7
- VectorVest RealTime Derby Tool
- VectorVest Simulator
- VectorVest Variator
- VectorVest Watchdog
- StockCharts.com, Inc.
- Candle Patterns
- Candlestick Charting Explained
- Intermarket Technical Analysis
- John Murphy on Chart Analysis
- John Murphy's Chart Pattern Recognition
- John Murphy's Market Message
- MurphyExplainsMarketAnalysis-Intermarket Analysis
- MurphyExplainsMarketAnalysis-Visual Analysis
- StockCharts.com
- Technical Analysis of the Financial Markets
- The Visual Investor
