HOT TOPICS LIST
- MACD
- Fibonacci
- RSI
- Gann
- ADXR
- Stochastics
- Volume
- Triangles
- Futures
- Cycles
- Volatility
- ZIGZAG
- MESA
- Retracement
- Aroon
INDICATORS LIST
LIST OF TOPICS
PRINT THIS ARTICLE
by Donald W. Pendergast, Jr.
After nearly six months of sideways to declining price movement, shares of Dow Chemical may have finally caught a bid, ready to rise strongly into early November 2012.
Position: N/A
Donald W. Pendergast, Jr.
Freelance financial markets writer and online publisher of the Trendzetterz.com S&P 500 Weekly Forecast service.
PRINT THIS ARTICLE
BREAKOUTS
Dow Chemical Volume And Price Breakout
10/22/12 08:49:54 AMby Donald W. Pendergast, Jr.
After nearly six months of sideways to declining price movement, shares of Dow Chemical may have finally caught a bid, ready to rise strongly into early November 2012.
Position: N/A
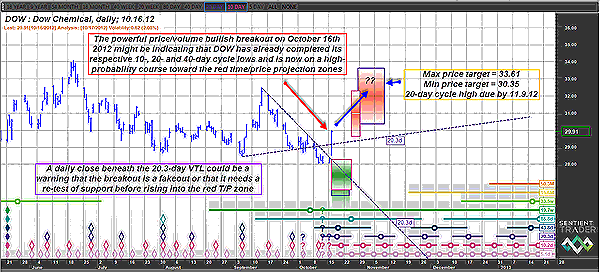
| After making a major multicycle high on April 25, 2012, shares of Dow Chemical (DOW) began a long, slow correction of more than 22%, taking the stock down as low as 28.01 on October 12, 2012. Careful price cycle analysis of DOW's five-day through 80-day cycles had already confirmed that the stock was likely to make a major low sometime during the final 10 days of October 2012, but the sudden appearance of a massive, bullish price/volume breakout on October 16, 2012, now leaves technicians scratching their heads, wondering if all of the cycles have bottomed early (very possible) or if the breakout is still part of the process of putting in a final low, with a retest of the low at 28.01 to be attempted before a sustained rally can take root. Here's a closer look to see if we can make more sense out of DOW's latest surprise move. |

|
| FIGURE 1: DOW, DAILY. Dow Chemical's powerful price/volume breakout is impressive, but be aware that the long-term money flow in the stock is still bearish, with no sign of a positive divergence with price yet. |
| Graphic provided by: Sentient Trader. |
| |
| Analysis of DOW's long-term money flow trend indicates that distribution is still under way, with no sign at all of a bullish price/money flow divergence yet apparent; the absolute level of the Chaikin money flow (CMF)(100) is also beneath its zero line, yet another bearish factor to consider (Figure 1). Considering the weak money flow trend, the big rally on Tuesday, October 16 was a real surprise. Typically, you will see a period of obviously bullish price/money flow divergence prior to a big bullish reversal, but that's just not the case now with DOW. The stock is still trading below its 200-day exponential moving average (EMA) (which is currently near 30.80) but has finally managed to close above its 50-day EMA and its 20.3-day valid trendline (VTL), and those are both very bullish factors to consider. An educated technician's guess is that DOW will likely need to put in some sort of a double-bottom pattern, dipping back into the green shaded time/price (TP) projection zone on the chart before a sustained run up into the red TP zone can be achieved. Again, the poor money flow trend makes the idea of a fast, unbroken run up into the upper red TP zone a hard sell. Some sort of a pullback in DOW seems virtually certain before an all-clear signal to buy DOW will be given, preferably by a good mechanical swing trading system. |

|
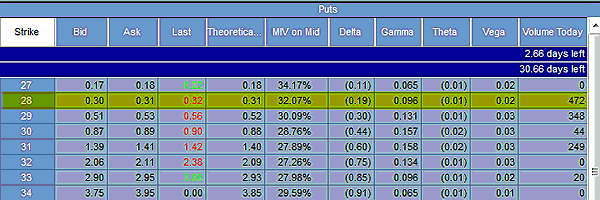
| FIGURE 2: PUTS. Should DOW continue to surge, skilled option traders might consider selling the November '12 DOW $28.00 puts; the delta is very small (0.19) and daily time decay will rapidly increase during the remaining life of the option. |
| Graphic provided by: TradeStation. |
| |
| If you do see a modest pullback in DOW, followed by a break above Tuesday's high of 29.99, consider selling a November '12 DOW put option at the $28.00 strike price (Figure 2). The put is selling for about $0.30 ($30 per contract before commissions and slippage) a small delta of (0.19) and an open interest figure of 472 contracts. With only 30 days to expiration, this option time decay will rapidly accelerate between now and November options expiration, putting some extra mathematical advantage on the side of DOW bulls who may be looking to pocket some extra cash -- if the anticipated rally into the red TP actually occurs as anticipated, of course. If you sell this put for, say 0.28, consider buying it back for a profit if it declines in value to 0.07 or less and buy it back for a loss if it rises to 0.54. Risk no more than 2% of your account equity on this or any other trade you make in the stock or stock options market and always use strict risk control to help ensure your longevity as a trader. |
Freelance financial markets writer and online publisher of the Trendzetterz.com S&P 500 Weekly Forecast service.
| Title: | Market consultant and writer |
| Company: | Trendzetterz |
| Address: | 81 Hickory Hollow Drive |
| Crossville, TN 38555 | |
| Phone # for sales: | 904-303-4814 |
| Website: | trendzetterz.com |
| E-mail address: | support@trendzetterz.com |
Traders' Resource Links | |
| Trendzetterz has not added any product or service information to TRADERS' RESOURCE. | |
Click here for more information about our publications!
PRINT THIS ARTICLE

Request Information From Our Sponsors
- StockCharts.com, Inc.
- Candle Patterns
- Candlestick Charting Explained
- Intermarket Technical Analysis
- John Murphy on Chart Analysis
- John Murphy's Chart Pattern Recognition
- John Murphy's Market Message
- MurphyExplainsMarketAnalysis-Intermarket Analysis
- MurphyExplainsMarketAnalysis-Visual Analysis
- StockCharts.com
- Technical Analysis of the Financial Markets
- The Visual Investor
- VectorVest, Inc.
- Executive Premier Workshop
- One-Day Options Course
- OptionsPro
- Retirement Income Workshop
- Sure-Fire Trading Systems (VectorVest, Inc.)
- Trading as a Business Workshop
- VectorVest 7 EOD
- VectorVest 7 RealTime/IntraDay
- VectorVest AutoTester
- VectorVest Educational Services
- VectorVest OnLine
- VectorVest Options Analyzer
- VectorVest ProGraphics v6.0
- VectorVest ProTrader 7
- VectorVest RealTime Derby Tool
- VectorVest Simulator
- VectorVest Variator
- VectorVest Watchdog
