HOT TOPICS LIST
- MACD
- Fibonacci
- RSI
- Gann
- ADXR
- Stochastics
- Volume
- Triangles
- Futures
- Cycles
- Volatility
- ZIGZAG
- MESA
- Retracement
- Aroon
INDICATORS LIST
LIST OF TOPICS
PRINT THIS ARTICLE
by Andrew Hetherington
Trend channels within a larger head and shoulders formation make this stock tradable in a number of ways.
Position: N/A
Andrew Hetherington
Classic Dow Theorist who trades as a pure technician, using pattern recognition.
PRINT THIS ARTICLE
CHART ANALYSIS
E.I. DuPont de Nemours and Company (DD) Are Looking Weak!
07/16/02 12:39:00 PMby Andrew Hetherington
Trend channels within a larger head and shoulders formation make this stock tradable in a number of ways.
Position: N/A

|
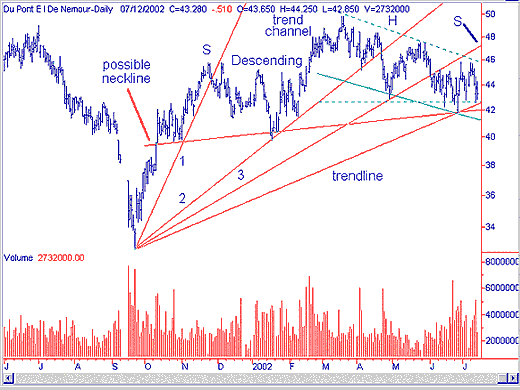
| Figure 1: Daily chart of DuPont. |
| Graphic provided by: SuperCharts. |
| |
| Figure 1 shows a 6-month descending triangle with decent volume on the creation of the pattern. The volume is not perfect but is acceptable. The last part of the triangle has slightly higher volumes that distort the puzzle a little, but it is still a triangle. There is also a trend channel, illustrated by solid and dotted green lines. Some people are apparently trading off of the top and bottom lines of these channels. I don't recommend this style since most of these channels have broken on the downside at one point or another and are undependable. |
| If you are so inclined, the method works by finding a clearly defined channel, as this one is, and shorting off of the top line or buying long off of the bottom line. It's common sense to use buy stops or stop losses that are fairly tight in these scenarios to protect your downside risk. You should place your stops just above or slightly below the top and bottom lines. In addition, a third fan line has broken, signalling a temporary change in direction from up to down. Lastly, all this is occurring within a larger head and shoulders that is forming. Currently this pattern is 9-months long and if it comes to fruition you can anticipate another two to three months to form the right shoulder. |
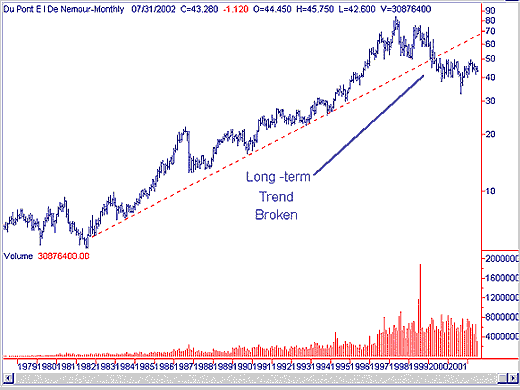
The neckline is upsloping and this is how I prefer them on head and shoulders top reversal patterns. I also prefer spiking volume on the left shoulder but it is acceptable for the volume to be slightly higher in a cumulative sense on the head as in this example. I've drawn the possible neckline in the $42.00 area. Figure 2: Weekly chart of DuPont. Figure 2 illustrates the overall weakness in this equity. The long-term trend from 1982 was broken in March, 2000. This sideways consolidation is a prerequisite for this slow moving turtle before the inevitable drop. |
Classic Dow Theorist who trades as a pure technician, using pattern recognition.
| Toronto, Canada |
Click here for more information about our publications!
Comments
Date: 08/17/02Rank: 5Comment:

Request Information From Our Sponsors
- StockCharts.com, Inc.
- Candle Patterns
- Candlestick Charting Explained
- Intermarket Technical Analysis
- John Murphy on Chart Analysis
- John Murphy's Chart Pattern Recognition
- John Murphy's Market Message
- MurphyExplainsMarketAnalysis-Intermarket Analysis
- MurphyExplainsMarketAnalysis-Visual Analysis
- StockCharts.com
- Technical Analysis of the Financial Markets
- The Visual Investor
- VectorVest, Inc.
- Executive Premier Workshop
- One-Day Options Course
- OptionsPro
- Retirement Income Workshop
- Sure-Fire Trading Systems (VectorVest, Inc.)
- Trading as a Business Workshop
- VectorVest 7 EOD
- VectorVest 7 RealTime/IntraDay
- VectorVest AutoTester
- VectorVest Educational Services
- VectorVest OnLine
- VectorVest Options Analyzer
- VectorVest ProGraphics v6.0
- VectorVest ProTrader 7
- VectorVest RealTime Derby Tool
- VectorVest Simulator
- VectorVest Variator
- VectorVest Watchdog
