HOT TOPICS LIST
- MACD
- Fibonacci
- RSI
- Gann
- ADXR
- Stochastics
- Volume
- Triangles
- Futures
- Cycles
- Volatility
- ZIGZAG
- MESA
- Retracement
- Aroon
INDICATORS LIST
LIST OF TOPICS
PRINT THIS ARTICLE
by Billy Williams
There are three things taking place that can lead to big profits if you know what they are and where to trade.
Position: Buy
Billy Williams
Billy Williams has been trading the markets for 27 years, specializing in momentum trading with stocks and options.
PRINT THIS ARTICLE
STRATEGIES
Pullbacks, The Bend, And The Cryptkeeper
10/18/12 08:40:53 AMby Billy Williams
There are three things taking place that can lead to big profits if you know what they are and where to trade.
Position: Buy
| Lately, the market has had more twists than a corkscrew as economic forecasts are being made and investors try to make sense of it. The reality is that this is a professional's market, and Joe Sixpack who is still using a 20th-century model to try and build prosperity for himself in his golden years is in for a wake-up call. You can't use an out-of-date strategy in a given framework if the underlying market type doesn't suit it. Bottom line, you have to be able to adapt to the market with a combination of risk control and a reliable trading approach that matches your own personality so you have the discipline to follow it through good times and bad. You are living in a lost decade, where the paradigms of "investing for the long term" and other old sayings are sounding hollow and rusty, given the fact that the market has been in a prolonged trading range since the dotcom era. Unable to make new ground, most portfolios' performance are lackluster at best with poor prospects on horizon. |

|
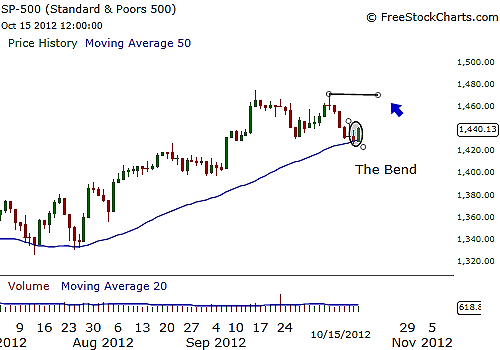
| FIGURE 1: SPX. After a failed resumption of its bullish trend, the SPX formed a bend, or market turn, in its price action today but still needs to clear the "cryptkeeper" before signaling a long entry. |
| Graphic provided by: www.freestockcharts.com. |
| |
| GDP growth is anemic in the US at 1.3% and is in bad need of the type of 4% robust growth necessary to support private sector growth and badly needed job growth. With a manic-depressive economic climate where one report comes in fair and another poorly, you have to rely on your skills as a trader and/or investor to become more selective about where you deploy your investment capital and how you maximize your return. So far, price action is the best determinant on how a stock is likely to perform, and one of the safest ways of trading is during a pullback into a strong moving stock. |

|
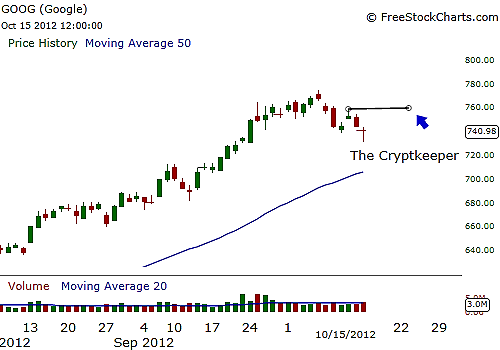
| FIGURE 2: GOOG. Stocks that mirror the overall market's price action, or experience a "plurality of patterns," are likely to move in tandem with the larger markets and go higher, as in Google's case. |
| Graphic provided by: www.freestockcharts.com. |
| |
| The market recently failed to resume its trend after a brief pullback but today formed a "bend," a market turn, at the 50-day simple moving average (SMA), a widely observed indicator followed by the major institutional traders. Price trading at this level of support warrants a closer look and if price can trade above the intraday high of October 5, 2012, then not only can the SPX trade to higher ground but it can likely take high-performing stocks with it. See Figures 1 and 2. First, stocks tend to move in tandem with the larger overall market with 70% to 80% of stocks trading in the same direction. Second, you should look for a "plurality of patterns" where the price action of the major indexes are mirrored by the stocks themselves, particularly the stock leaders. It is in these moments that opportunities are forming just before a major move is about to occur. |
| Google is mirroring the SPX as it also failed a resumption of its trend after being on a hard bull run for the last several weeks. During its pullback, price traded higher but then rolled over before finding its legs and appears as if might make a go of it again by trading higher. But it first has to trade above "the cryptkeeper," which is the former intraday high before price rolled over. If price trades up through the cryptkeeper, a long signal is confirmed with the benefit of having similar price action to the SPX that is in a confirmed uptrend, and in a high-performing stock whose trend has been in place for several weeks now. |
Billy Williams has been trading the markets for 27 years, specializing in momentum trading with stocks and options.
| Company: | StockOptionSystem.com |
| E-mail address: | stockoptionsystem.com@gmail.com |
Traders' Resource Links | |
| StockOptionSystem.com has not added any product or service information to TRADERS' RESOURCE. | |
Click here for more information about our publications!
PRINT THIS ARTICLE

|

Request Information From Our Sponsors
- StockCharts.com, Inc.
- Candle Patterns
- Candlestick Charting Explained
- Intermarket Technical Analysis
- John Murphy on Chart Analysis
- John Murphy's Chart Pattern Recognition
- John Murphy's Market Message
- MurphyExplainsMarketAnalysis-Intermarket Analysis
- MurphyExplainsMarketAnalysis-Visual Analysis
- StockCharts.com
- Technical Analysis of the Financial Markets
- The Visual Investor
- VectorVest, Inc.
- Executive Premier Workshop
- One-Day Options Course
- OptionsPro
- Retirement Income Workshop
- Sure-Fire Trading Systems (VectorVest, Inc.)
- Trading as a Business Workshop
- VectorVest 7 EOD
- VectorVest 7 RealTime/IntraDay
- VectorVest AutoTester
- VectorVest Educational Services
- VectorVest OnLine
- VectorVest Options Analyzer
- VectorVest ProGraphics v6.0
- VectorVest ProTrader 7
- VectorVest RealTime Derby Tool
- VectorVest Simulator
- VectorVest Variator
- VectorVest Watchdog
