HOT TOPICS LIST
- MACD
- Fibonacci
- RSI
- Gann
- ADXR
- Stochastics
- Volume
- Triangles
- Futures
- Cycles
- Volatility
- ZIGZAG
- MESA
- Retracement
- Aroon
INDICATORS LIST
LIST OF TOPICS
PRINT THIS ARTICLE
by Donald W. Pendergast, Jr.
The Standard & Poor's 500 has had quite a bullish run since early June 2012, and now four different price cycles are suggesting that more gains are possible once another multicycle low is complete.
Position: N/A
Donald W. Pendergast, Jr.
Freelance financial markets writer and online publisher of the Trendzetterz.com S&P 500 Weekly Forecast service.
PRINT THIS ARTICLE
CYCLES
.SPX Multicycle Low Rapidly Approaching?
10/18/12 08:09:09 AMby Donald W. Pendergast, Jr.
The Standard & Poor's 500 has had quite a bullish run since early June 2012, and now four different price cycles are suggesting that more gains are possible once another multicycle low is complete.
Position: N/A
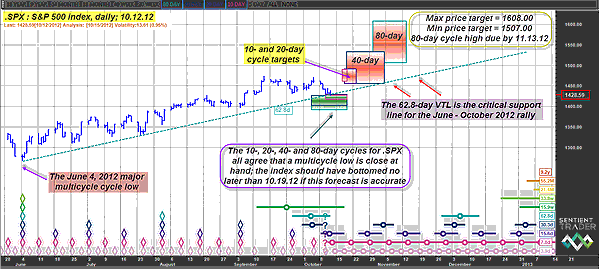
| The broad US markets have enjoyed a terrific rally since making a major multicycle low on June 4, 2012. Seven separate cycles bottomed at the same time back then, helping set the stage for the powerful rally that made its most recent swing high of 1474.51 on September 14, 2012. The .SPX has drifted in a sideways to slightly lower pattern over the past month and is now projected to be very near to entering the final descent into a multicycle low as its 10-, 20-, 40- and 80-day cycles all bottom together between now and October 19, 2012. The maximum anticipated decline before a tradable rally erupts is 1391.61 and the minimum price target on the pullback into the low is 1417.86. Note that on .SPX's daily cycles chart (Figure 1) that its Friday (October 12) closing price was right near the 62.8-day valid trendline (VTL); a daily close below the line (currently near 1428.00) may be a good indication of .SPX's intention to drop further into the various green time/price projection zones -- all of which are anticipated to have seen a swing low by no later than October 19. This trendline is an important one for the index, as it is clearly defining the strength and persistent bullishness of the entire 18-week rally. |

|
| FIGURE 1: SPX, DAILY. The S&P 500 is at or very near to making a significant multicycle low (green shaded zones), after which a fairly strong rally is anticipated. |
| Graphic provided by: Sentient Trader. |
| |
| Once the .SPX does complete this upcoming multicycle low, the next item of business is to start anticipating how far the index may rise on any subsequent rally. The red boxes indicate the time/price projections for each of the previously mentioned cycles; the 10-and 20-day cycles have the smallest footprint and may be more accurate in forecasting near-term price action. Both are suggesting that the .SPX may make it back into the range of 1455.00 to 1490.00 by October 23, 2012. If this is accurate, then a strong rally needs to erupt within the next few trading sessions and it could be a turnaround by key energy and basic materials stocks that could fuel such a short-term rally. Going out a bit further, the 40- and 80-day cycles present us with more bullish price targets, with the latter cycle calling for a cycle high between October 30 and November 13, 2012. The expected price range for the .SPX extends from 1507.00 to 1608.00. The 40-day cycle targets are a bit less bullish but still put the index somewhere between 1455.00 and 1532.00 with a cycle-high window extending from October 19 to November 4, 2012. Overall, the short-term and medium-term price cycles for the index are highly suggestive of more upside into at least late October to mid-November 2012, so this could be a good time to start building a shopping list of fundamentally attractive, high relative strength stocks. |

|
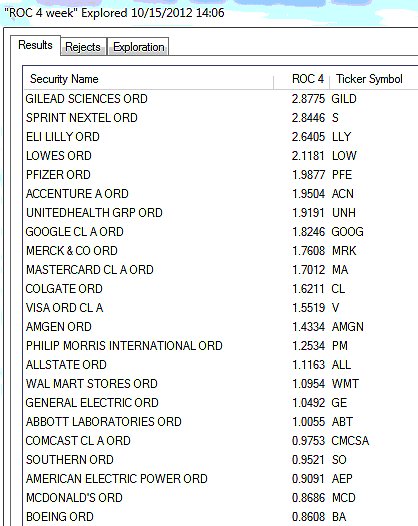
| FIGURE 2: OEX. Here are the .OEX component stocks that are outperforming the .SPX over the past four weeks. |
| Graphic provided by: MetaStock. |
| Graphic provided by: MetaStock Explorer. |
| |
| In Figure 2, you can see a list of the strongest .OEX stocks in terms of their four-week comparative relative strength vs. the .SPX. Keep a close eye on these names for new mechanical buy signals between now and October 19, 2012 (at which point the .SPX is expected to bottom in four consecutive cycles), as those that do issue "go long" signals could be the stocks that help lead the entire index up into any one of the four red time/price projection zones over the next month or so. As always, trade wisely until we meet here again. |
Freelance financial markets writer and online publisher of the Trendzetterz.com S&P 500 Weekly Forecast service.
| Title: | Market consultant and writer |
| Company: | Trendzetterz |
| Address: | 81 Hickory Hollow Drive |
| Crossville, TN 38555 | |
| Phone # for sales: | 904-303-4814 |
| Website: | trendzetterz.com |
| E-mail address: | support@trendzetterz.com |
Traders' Resource Links | |
| Trendzetterz has not added any product or service information to TRADERS' RESOURCE. | |
Click here for more information about our publications!
PRINT THIS ARTICLE

Request Information From Our Sponsors
- StockCharts.com, Inc.
- Candle Patterns
- Candlestick Charting Explained
- Intermarket Technical Analysis
- John Murphy on Chart Analysis
- John Murphy's Chart Pattern Recognition
- John Murphy's Market Message
- MurphyExplainsMarketAnalysis-Intermarket Analysis
- MurphyExplainsMarketAnalysis-Visual Analysis
- StockCharts.com
- Technical Analysis of the Financial Markets
- The Visual Investor
- VectorVest, Inc.
- Executive Premier Workshop
- One-Day Options Course
- OptionsPro
- Retirement Income Workshop
- Sure-Fire Trading Systems (VectorVest, Inc.)
- Trading as a Business Workshop
- VectorVest 7 EOD
- VectorVest 7 RealTime/IntraDay
- VectorVest AutoTester
- VectorVest Educational Services
- VectorVest OnLine
- VectorVest Options Analyzer
- VectorVest ProGraphics v6.0
- VectorVest ProTrader 7
- VectorVest RealTime Derby Tool
- VectorVest Simulator
- VectorVest Variator
- VectorVest Watchdog
