HOT TOPICS LIST
- MACD
- Fibonacci
- RSI
- Gann
- ADXR
- Stochastics
- Volume
- Triangles
- Futures
- Cycles
- Volatility
- ZIGZAG
- MESA
- Retracement
- Aroon
INDICATORS LIST
LIST OF TOPICS
PRINT THIS ARTICLE
by Koos van der Merwe
Using a program to look for future buys is always a must and should be looked at carefully.
Position: Accumulate
Koos van der Merwe
Has been a technical analyst since 1969, and has worked as a futures and options trader with First Financial Futures in Johannesburg, South Africa.
PRINT THIS ARTICLE
RISING TREND
Is Mattel Swell Enough To Be A Buy?
10/17/12 10:57:05 AMby Koos van der Merwe
Using a program to look for future buys is always a must and should be looked at carefully.
Position: Accumulate
| Children like toys, no matter how depressed the market is, and parents will go out of their way to have those gifts under the Christmas tree or at the birthday party. So when Mattel Inc. (MAT) gives a buy signal on an explorer program, it is not something that should be ignored. |

|
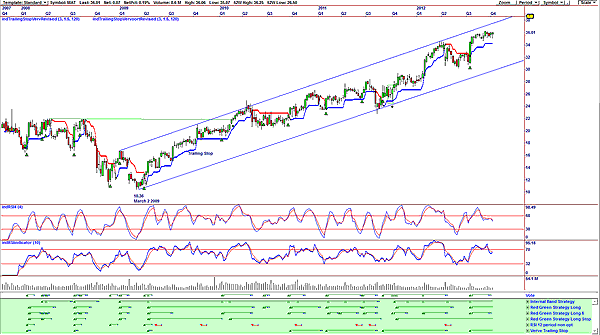
| FIGURE 1: MAT, WEEKLY. Here's a chart of Mattel showing the trend since 2009. |
| Graphic provided by: OmniTrader. |
| |
| Figure 1 is a weekly chart of Mattel Inc. and shows how the price moved from a low of $10.36 on March 2, 2009, to its current high of $36.01. The chart shows how the share price has risen within a support & resistance line, buy signals were given by the vote line, based on the six strategies shown in green below the vote line. Sell signals were given when the share price broke below the trailing stop. At the moment, the four-period relative strength index (RSI) and the 10-period RSI are both suggesting a sell. The price is moving sideways and has not yet broken below the trailing stop, confirming a sell signal. The vote line has given a stop, though. What does the daily chart say? |

|
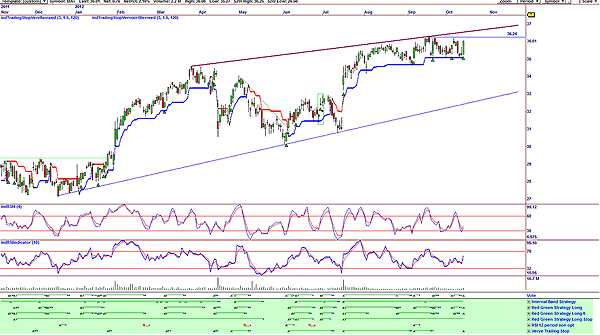
| FIGURE 2: MAT, DAILY. Here's a chart showing a vote line buy signal. |
| Graphic provided by: OmniTrader. |
| |
| Figure 2, the daily chart, was the one that alerted me to look at MAT, because the vote line brought the share to my attention by giving a buy signal. In the chart, the buy signal in the vote line was triggered by all the strategies except the RSI 12-period strategy. The indicators on the chart does show that a buy signal is given by the RSI four-period indicator, but not by the RSI 10-period indicator. With the share price moving sideways, I would rather wait for a move above the upper pivot point of $36.24 before buying. The share does look very attractive and should be watched. That the price is holding its position above the trailing stop is also a strong positive. |
Has been a technical analyst since 1969, and has worked as a futures and options trader with First Financial Futures in Johannesburg, South Africa.
| Address: | 3256 West 24th Ave |
| Vancouver, BC | |
| Phone # for sales: | 6042634214 |
| E-mail address: | petroosp@gmail.com |
Click here for more information about our publications!
Comments

Request Information From Our Sponsors
- StockCharts.com, Inc.
- Candle Patterns
- Candlestick Charting Explained
- Intermarket Technical Analysis
- John Murphy on Chart Analysis
- John Murphy's Chart Pattern Recognition
- John Murphy's Market Message
- MurphyExplainsMarketAnalysis-Intermarket Analysis
- MurphyExplainsMarketAnalysis-Visual Analysis
- StockCharts.com
- Technical Analysis of the Financial Markets
- The Visual Investor
- VectorVest, Inc.
- Executive Premier Workshop
- One-Day Options Course
- OptionsPro
- Retirement Income Workshop
- Sure-Fire Trading Systems (VectorVest, Inc.)
- Trading as a Business Workshop
- VectorVest 7 EOD
- VectorVest 7 RealTime/IntraDay
- VectorVest AutoTester
- VectorVest Educational Services
- VectorVest OnLine
- VectorVest Options Analyzer
- VectorVest ProGraphics v6.0
- VectorVest ProTrader 7
- VectorVest RealTime Derby Tool
- VectorVest Simulator
- VectorVest Variator
- VectorVest Watchdog
