HOT TOPICS LIST
- MACD
- Fibonacci
- RSI
- Gann
- ADXR
- Stochastics
- Volume
- Triangles
- Futures
- Cycles
- Volatility
- ZIGZAG
- MESA
- Retracement
- Aroon
INDICATORS LIST
LIST OF TOPICS
PRINT THIS ARTICLE
by Koos van der Merwe
Amazon's Kindle Fire has very much been a winner. With the smaller Apple iPad rumored to be out in the near future, how is this going to affect sales for Amazon?
Position: Accumulate
Koos van der Merwe
Has been a technical analyst since 1969, and has worked as a futures and options trader with First Financial Futures in Johannesburg, South Africa.
PRINT THIS ARTICLE
ELLIOTT WAVE
Amazon Update
10/16/12 08:00:59 AMby Koos van der Merwe
Amazon's Kindle Fire has very much been a winner. With the smaller Apple iPad rumored to be out in the near future, how is this going to affect sales for Amazon?
Position: Accumulate
| Amazon has pitched the price of its Kindle Fire at cost price, relying on sales of ebooks for its profit. Will Apple do the same with the launch of its mini iPad? This is a wait-and-see situation, but how are Amazon's shares being affected? |

|
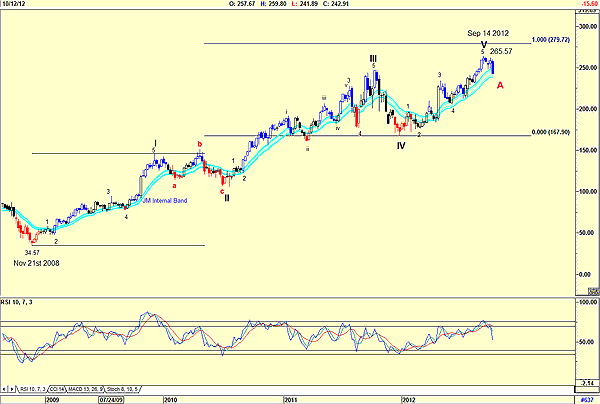
| FIGURE 1: AMZN, WEEKLY. This chart suggests a wave 5 top. |
| Graphic provided by: AdvancedGET. |
| |
| Figure 1 is a weekly chart of Amazon, showing how the price rose from a low of $34.57 in November 2008 to a high of $265.57 by September 2012. The Elliott wave count does look reasonable, with the exception of wave III, where the count is reasonably complicated, something not unexpected for a third wave. The count for wave V also looks correct, but I must admit that wave V should equal wave I, and at $265.57 it did not equal wave I. The target should have been $279.72 as shown on the chart. This does not mean that my assumption that at $265.57 IS the wave V top could be wrong, and we could see the price rising higher. The relative strength index (RSI) has however, given a sell signal, and is trending down, so until I understand otherwise, I will accept the count as being correct. Never forget that Elliott wave count is simply a signpost and can change quickly down the road. The JM internal band is still in buy mode; the price has not penetrated the lower band. The RSI is suggesting that it may, however, so it does suggest watching closely. |

|
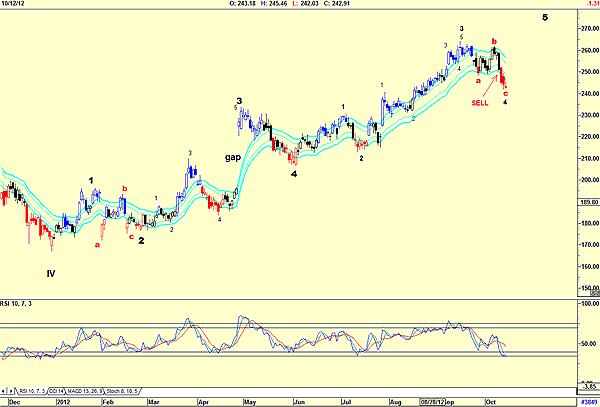
| FIGURE 2: AMZN, DAILY. This chart suggests a wave 5 top still to come. |
| Graphic provided by: AdvancedGET. |
| |
| Figure 2 is a daily chart of AMZN, and my Elliott wave count suggests that the price is in a wave 4 correction with wave 5 still to come. This does look very possible, especially with the RSI at oversold levels. Note that the price has given a sell signal on the JM internal band indicator by breaking below the lower band line. The JM internal band indicator is a 15-period simple moving average offset by 2% positive and 2% negative. I would be a buyer of AMZN if I were a bottom picker as the RSI turns and gives a buy signal. On the more conservative side, I would only buy the share should it break above the upper band of the JM internal band. |
Has been a technical analyst since 1969, and has worked as a futures and options trader with First Financial Futures in Johannesburg, South Africa.
| Address: | 3256 West 24th Ave |
| Vancouver, BC | |
| Phone # for sales: | 6042634214 |
| E-mail address: | petroosp@gmail.com |
Click here for more information about our publications!
PRINT THIS ARTICLE

Request Information From Our Sponsors
- StockCharts.com, Inc.
- Candle Patterns
- Candlestick Charting Explained
- Intermarket Technical Analysis
- John Murphy on Chart Analysis
- John Murphy's Chart Pattern Recognition
- John Murphy's Market Message
- MurphyExplainsMarketAnalysis-Intermarket Analysis
- MurphyExplainsMarketAnalysis-Visual Analysis
- StockCharts.com
- Technical Analysis of the Financial Markets
- The Visual Investor
- VectorVest, Inc.
- Executive Premier Workshop
- One-Day Options Course
- OptionsPro
- Retirement Income Workshop
- Sure-Fire Trading Systems (VectorVest, Inc.)
- Trading as a Business Workshop
- VectorVest 7 EOD
- VectorVest 7 RealTime/IntraDay
- VectorVest AutoTester
- VectorVest Educational Services
- VectorVest OnLine
- VectorVest Options Analyzer
- VectorVest ProGraphics v6.0
- VectorVest ProTrader 7
- VectorVest RealTime Derby Tool
- VectorVest Simulator
- VectorVest Variator
- VectorVest Watchdog
