HOT TOPICS LIST
- MACD
- Fibonacci
- RSI
- Gann
- ADXR
- Stochastics
- Volume
- Triangles
- Futures
- Cycles
- Volatility
- ZIGZAG
- MESA
- Retracement
- Aroon
INDICATORS LIST
LIST OF TOPICS
PRINT THIS ARTICLE
by Donald W. Pendergast, Jr.
Shares of the iShares Silver Trust rose by more than 34% between late June and late September 2012, with even more gains possible over the next few weeks.
Position: N/A
Donald W. Pendergast, Jr.
Freelance financial markets writer and online publisher of the Trendzetterz.com S&P 500 Weekly Forecast service.
PRINT THIS ARTICLE
CYCLES
SLV Continuation Move Soon?
10/17/12 08:46:36 AMby Donald W. Pendergast, Jr.
Shares of the iShares Silver Trust rose by more than 34% between late June and late September 2012, with even more gains possible over the next few weeks.
Position: N/A
| The silver market is a volatile and exciting place to experience the thrills of victory as well as the agony of defeat, depending on how good (or bad) a trader you may actually be. Traders and investors who use a proven, disciplined mechanical trading strategy with limited per-trade risk are really the only ones who can ever hope to consistently profit from the violent, sudden shifts in momentum that this most emotional of financial markets has and will continue to make. With that firmly in mind, here's a look at the 20-day cycle status for the iShares Silver Trust (SLV), along with an interpretation of how the cycle time/price projections fit in with the overall technical structure of this market since it made its last major multicycle low in late June 2012. |

|
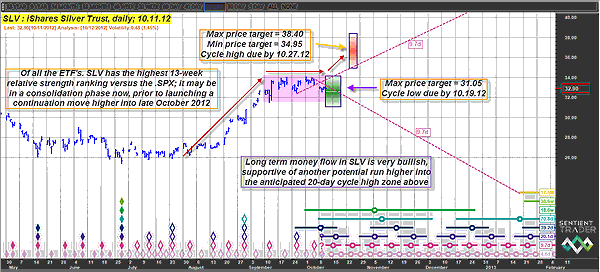
| FIGURE 1: SLV, DAILY. With positive short- and long-term money flows in place, the probabilities of SLV mounting a bullish continuation move from its current consolidation appear to very high, particularly once its next 20-day cycle low is completed. |
| Graphic provided by: Sentient Trader. |
| |
| SLV made a major multicycle low on June 28, 2012, bottoming out at 25.34 as seven separate cycles all exhausted their downward momentum in unison. SLV, unlike some other freely traded, high volume exchange traded funds (ETFs), can trade in very choppy, chaotic fashion, even after a major low like that is made, and the price action in the stock between that low and early August 2012 was hardly inspiring to silver bulls. See Figure 1. It took until August 20, 2012, before SLV really had a strong upside break with a powerful trending move following soon after. The entire move from the late June 2012 low to the September 21, 2012, high saw a gain of 34.3% for SLV before profit takers decided to take some money off of the table, putting the ETF into the current three-week consolidation in which is now enmeshed. Long- and short-term money flows remain strongly bullish as the consolidation wears on, hinting that SLV may have its sights set on making a continuation move higher from the current range -- probably soon rather than later. |

|
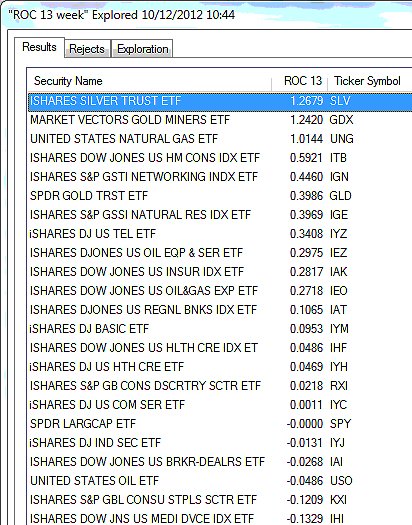
| FIGURE 2: SLV RATE OF CHANGE. The iShares Silver Trust (SLV) is far outperforming the .SPX over the last 13 weeks. |
| Graphic provided by: MetaStock. |
| Graphic provided by: MetaStock Explorer. |
| |
| Price cycle analysis for SLV reveals that its nominal 20-day cycle is due to bottom (somewhere in the green zone on the chart) no later than October 19, 2012, and a price level no lower than 31.05, after which it is anticipated to rise into its 20-day cycle high sometime between October 23 and October 27. The red shaded time/price projection zone is also forecasting a possible rise by SLV that could be as high as 34.95 to 38.40 per share within that particular time window. If we also consider that SLV is currently forming what could ultimately turn out to be a bullish continuation pattern, then the positive money flow and price cycle data helps gel the entire technical situation for SLV into a decidedly bullish image. SLV has the highest 13-week comparative relative strength of all major ETFs versus the .SPX and is far outperforming its golden cousin (GLD) over the same time period, which helps bathe SLV in an even more bullish light. See Figure 2. |
| The most intelligent way to play SLV in anticipation of a bullish break higher toward the red 20-day cycle high zone would be to use the proven mechanical system of your choice (a simple 20-day channel breakout system would probably work just dandy) to actually time your long entry, using a three-bar trailing stop of the daily lows to help keep you out of trouble. You might want to use the lower boundary of the red zone (34.95) as your initial price target and then simply trail the balance for the life of the trade. As always, keep your account risk small (no more than 2%, ever) on this or any other trade you may have your heart set on making, since you really never know what a given market -- or the trades it offers you -- may decide to do at any time, especially the silver market. |
Freelance financial markets writer and online publisher of the Trendzetterz.com S&P 500 Weekly Forecast service.
| Title: | Market consultant and writer |
| Company: | Trendzetterz |
| Address: | 81 Hickory Hollow Drive |
| Crossville, TN 38555 | |
| Phone # for sales: | 904-303-4814 |
| Website: | trendzetterz.com |
| E-mail address: | support@trendzetterz.com |
Traders' Resource Links | |
| Trendzetterz has not added any product or service information to TRADERS' RESOURCE. | |
Click here for more information about our publications!
PRINT THIS ARTICLE

Request Information From Our Sponsors
- StockCharts.com, Inc.
- Candle Patterns
- Candlestick Charting Explained
- Intermarket Technical Analysis
- John Murphy on Chart Analysis
- John Murphy's Chart Pattern Recognition
- John Murphy's Market Message
- MurphyExplainsMarketAnalysis-Intermarket Analysis
- MurphyExplainsMarketAnalysis-Visual Analysis
- StockCharts.com
- Technical Analysis of the Financial Markets
- The Visual Investor
- VectorVest, Inc.
- Executive Premier Workshop
- One-Day Options Course
- OptionsPro
- Retirement Income Workshop
- Sure-Fire Trading Systems (VectorVest, Inc.)
- Trading as a Business Workshop
- VectorVest 7 EOD
- VectorVest 7 RealTime/IntraDay
- VectorVest AutoTester
- VectorVest Educational Services
- VectorVest OnLine
- VectorVest Options Analyzer
- VectorVest ProGraphics v6.0
- VectorVest ProTrader 7
- VectorVest RealTime Derby Tool
- VectorVest Simulator
- VectorVest Variator
- VectorVest Watchdog
