HOT TOPICS LIST
- MACD
- Fibonacci
- RSI
- Gann
- ADXR
- Stochastics
- Volume
- Triangles
- Futures
- Cycles
- Volatility
- ZIGZAG
- MESA
- Retracement
- Aroon
INDICATORS LIST
LIST OF TOPICS
PRINT THIS ARTICLE
by Chaitali Mohile
An ascending rally of Cheesecake Factory is showing reversal signs.
Position: N/A
Chaitali Mohile
Active trader in the Indian stock markets since 2003 and a full-time writer. Trading is largely based upon technical analysis.
PRINT THIS ARTICLE
TECHNICAL ANALYSIS
CAKE To Plunge A Few Layers
10/15/12 12:34:44 PMby Chaitali Mohile
An ascending rally of Cheesecake Factory is showing reversal signs.
Position: N/A
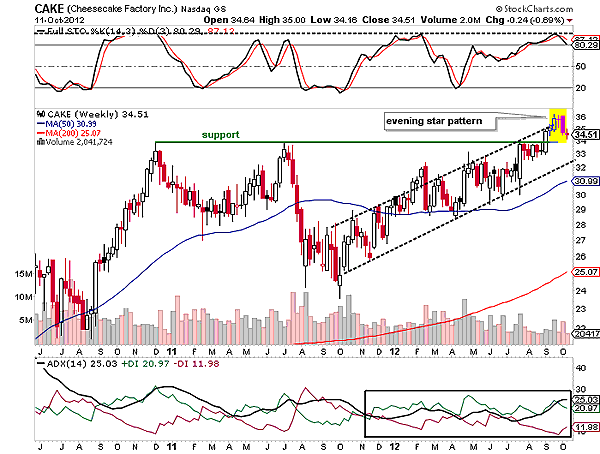
| Cheesecake Factory (CAKE) is a stock that could attract traders by its name alone. The stock has formed an ascending channel on the weekly time frame chart in Figure 1. The rally within the channel was rough and frequently challenged both trendlines. An equal pressure from the buyers and seller restricted a breakout in either direction. Recently, CAKE breached the previous high resistance, formed by the double-top formation in 2011-12. However, establishing support above the newly converted support is also an important task for the stock. |
| The highly overbought full stochastic (14,3,3) in Figure 1 is likely to reverse. The oscillator has lacked the strength to continue its journey in an overbought zone, affecting the price rally within the channel. It has been zigzagging between an oversold and overbought region. This suggests that the stock witnessed unstable momentum, causing turbulence in the rally. Due to equal buying and selling pressure, an uptrend failed to surge above 21 levels. The average directional index (ADX) (14) in Figure 1 was jittery till the buying pressure indicated by the positive directional index (+DI) grabbed the rally last month. The increased buying pressure pulled the price rally higher, breaching the upper trendline resistance of the channel. |

|
| FIGURE 1: CAKE, WEEKLY |
| Graphic provided by: StockCharts.com. |
| |
| Currently, the ADX (14) is unstable in a developing uptrend area. The tug of war between the buyers and sellers formed an evening star candlestick pattern at the top of the channel. The stochastic oscillator is likely to plunge from an overbought territory above 80 levels. These bearish indications, including the bearish reversal candlestick pattern (evening star), are likely to initiate a small downside rally. Here, the freshly formed support of the previous high at 34 levels (see the green line) will play an important role. However, the lower trendline breakout will be the trend reversal point for CAKE. |

|
| FIGURE 2: CAKE, DAILY |
| Graphic provided by: StockCharts.com. |
| |
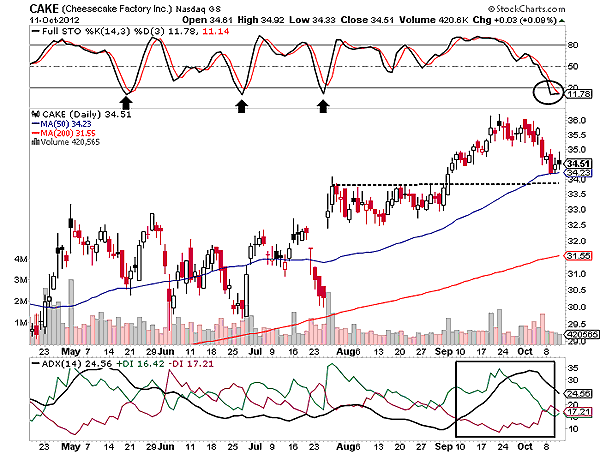
| On the daily time frame chart in Figure 2, the stock has formed a short-term rounded top -- a bearish reversal formation with the support of a previous consolidation range. The pattern has hit the 50-day moving average (MA) support. Currently, the stock is standing at a make-or-break point of the rally. In the past, the full stochastic (14,3,3) in Figure 2 had bounced back from an oversold area (20 levels). Currently, the oscillator is oversold, and therefore, it could follow a similar pattern. A well-developed uptrend has plunged to the developing levels, suggesting lack of buyers' interest. The +DI and the negative directional index (-DI) has tangled, thus creating a threat for the current rally. |
| Thus, all the three segments -- the ADX (14), price action, and the stochastic oscillator -- has to be observed carefully. If the oscillator follows history, the price and the ADX (14) is likely to surge. CAKE has moved closer to its historical high on the monthly time frame chart. Considering the big picture, CAKE is likely to reverse its ongoing bullish rally. |
Active trader in the Indian stock markets since 2003 and a full-time writer. Trading is largely based upon technical analysis.
| Company: | Independent |
| Address: | C1/3 Parth Indraprasth Towers. Vastrapur |
| Ahmedabad, Guj 380015 | |
| E-mail address: | chaitalimohile@yahoo.co.in |
Traders' Resource Links | |
| Independent has not added any product or service information to TRADERS' RESOURCE. | |
Click here for more information about our publications!
PRINT THIS ARTICLE

Request Information From Our Sponsors
- StockCharts.com, Inc.
- Candle Patterns
- Candlestick Charting Explained
- Intermarket Technical Analysis
- John Murphy on Chart Analysis
- John Murphy's Chart Pattern Recognition
- John Murphy's Market Message
- MurphyExplainsMarketAnalysis-Intermarket Analysis
- MurphyExplainsMarketAnalysis-Visual Analysis
- StockCharts.com
- Technical Analysis of the Financial Markets
- The Visual Investor
- VectorVest, Inc.
- Executive Premier Workshop
- One-Day Options Course
- OptionsPro
- Retirement Income Workshop
- Sure-Fire Trading Systems (VectorVest, Inc.)
- Trading as a Business Workshop
- VectorVest 7 EOD
- VectorVest 7 RealTime/IntraDay
- VectorVest AutoTester
- VectorVest Educational Services
- VectorVest OnLine
- VectorVest Options Analyzer
- VectorVest ProGraphics v6.0
- VectorVest ProTrader 7
- VectorVest RealTime Derby Tool
- VectorVest Simulator
- VectorVest Variator
- VectorVest Watchdog
