HOT TOPICS LIST
- MACD
- Fibonacci
- RSI
- Gann
- ADXR
- Stochastics
- Volume
- Triangles
- Futures
- Cycles
- Volatility
- ZIGZAG
- MESA
- Retracement
- Aroon
INDICATORS LIST
LIST OF TOPICS
PRINT THIS ARTICLE
by Donald W. Pendergast, Jr.
ExxonMobil stock has enjoyed a steady uptrend for more than 17 weeks now, but a pullback is likely due soon.
Position: N/A
Donald W. Pendergast, Jr.
Freelance financial markets writer and online publisher of the Trendzetterz.com S&P 500 Weekly Forecast service.
PRINT THIS ARTICLE
CYCLES
For ExxonMobil, A New High, Then A Cycle Low?
10/15/12 08:56:56 AMby Donald W. Pendergast, Jr.
ExxonMobil stock has enjoyed a steady uptrend for more than 17 weeks now, but a pullback is likely due soon.
Position: N/A
| ExxonMobil (XOM) shares trend a couple of times per year, while at other times the stock makes very tradable short-term swing moves that skilled stock and option traders can really put to good use. Currently, the stock is nearing the end of a very steady and profitable four-month uptrend, one that has seen the stock rise by as much as 21% from a major June 2012 multicycle low to its most recent high of 93.36 on October 9, 2012. However, two significant kinds of technical analysis strongly suggest that the stock is becoming more vulnerable to a noticeable pullback within the next three weeks. Here's a closer look. |

|
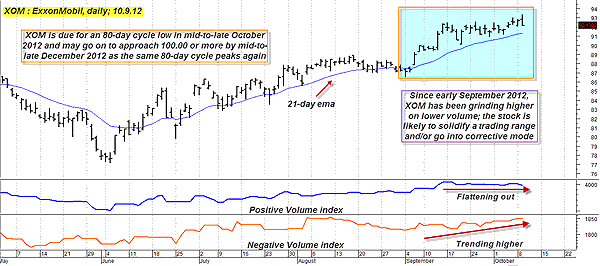
| FIGURE 1: XOM, DAILY. XOM has been drifting higher on flat to lower volume since early September 2012, possibly implying the start of a trading range or possible trend reversal. |
| Graphic provided by: MetaStock. |
| |
| Once a stock starts trending for a couple of months it tends to start attracting the attention of the financial media, traders and investors alike, and as the word spreads of the stock's powerful upward momentum, more and more market participants seek to pile in on each new pullback. Despite a violent shakeout move in late June 2012, XOM also began to attract more interest by early August 2012, just in time for latecomers to undergo a mild correction until early September 2012, after which XOM obliged by making yet another surge higher into early October 2012 -- making a new four-year high in the process. Experienced technicians and traders are always looking ahead, however, and the current money flow and price cycle action in the stock strongly suggests that XOM may soon be destined to correct a sizable portion of its summertime gains (Figure 1). The positive volume index (PVI) shows us the trend of a stock in terms of the relationship of its daily volume and daily gain or loss in percentage terms. When the PVI is trending higher, a stock is rising on increasing volume (bullish), and when the index is flat, the stock is moving sideways on increasing volume (neutral trend); when the PVI is declining, a stock is falling on increasing volume (bearish). The interpretation of the negative volume index (NVI) is the exact opposite of that for the PVI, and when we combine the output of both indicators, we can begin to make some useful assessments of the technical health of any given security that has adequate trading volume. What we see here on XOM's daily chart is that the PVI has been flat (neutral trend) for three weeks, while the NVI has been trending higher since early September 2012. This is suggestive of the start of a trading range/consolidation phase (very normal after such a long running uptrend) and/or the initial phase of what could turn into a significant pullback and/or trend reversal. The reason for these assessments is the fact that the rally phase of the past five weeks has been accomplished on mostly negative (lower) to flat volume, and this does not bode well for much more of a move higher in XOM for the near term. |

|
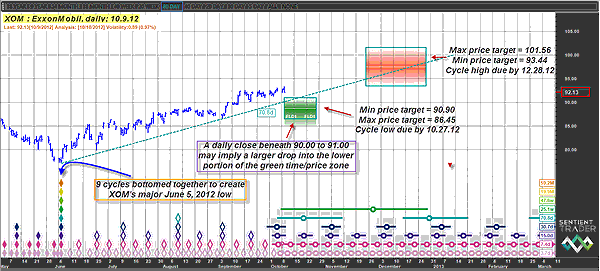
| FIGURE 2: XOM, DAILY. A daily close below 90.00 to 91.00 by mid-October 2012 may indicate that XOM intends to test the lower half of the 80-day cycle's time/price projection zone. |
| Graphic provided by: Sentient Trader. |
| |
| When you also consider that XOM -- according to its 80-day price cycle -- is also due to decline into its 80-day cycle low between now and October 27, 2012, and within a price range of 86.45 to 90.90, then you begin to see how multiple technical dynamics are working together to intitiate the next significant directional move in this giant-cap energy stock. See Figure 2. Note the dashed uptrend line on the chart. This is the 70.8-day valid trendline (VTL) and it has been a powerful trend-defining line in the sand for XOM's big rally. A daily close below this line (currently near 90.00) will confirm that the 25.1-week cycle has already made a confirmed cycle high and could release a lot of pent-up selling pressure that could easily drag XOM into the lower portion of the green shaded time/price projection zone by late October 2012. Once the cycle low is made, however, XOM is anticipated to rally yet again, possibly into late December 2012 and at a price level exceeding 100.00 per share. See the cycles chart for the possible time/price guidelines. |
| Traders and investors who are long XOM need to be running close trailing stops and/or actively planning to scale out of profitable open positions. Alternatively, they can also consider buying insurance in the form of protective put options with three to six months of time value remaining. The beauty of cycles and money flow analysis is that they typically give an educated trader/investor some early warning before a significant trend reversal or correction is due, unlike some other forms of chart reading. Trade wisely until we meet here again. |
Freelance financial markets writer and online publisher of the Trendzetterz.com S&P 500 Weekly Forecast service.
| Title: | Market consultant and writer |
| Company: | Trendzetterz |
| Address: | 81 Hickory Hollow Drive |
| Crossville, TN 38555 | |
| Phone # for sales: | 904-303-4814 |
| Website: | trendzetterz.com |
| E-mail address: | support@trendzetterz.com |
Traders' Resource Links | |
| Trendzetterz has not added any product or service information to TRADERS' RESOURCE. | |
Click here for more information about our publications!
PRINT THIS ARTICLE

|

Request Information From Our Sponsors
- StockCharts.com, Inc.
- Candle Patterns
- Candlestick Charting Explained
- Intermarket Technical Analysis
- John Murphy on Chart Analysis
- John Murphy's Chart Pattern Recognition
- John Murphy's Market Message
- MurphyExplainsMarketAnalysis-Intermarket Analysis
- MurphyExplainsMarketAnalysis-Visual Analysis
- StockCharts.com
- Technical Analysis of the Financial Markets
- The Visual Investor
- VectorVest, Inc.
- Executive Premier Workshop
- One-Day Options Course
- OptionsPro
- Retirement Income Workshop
- Sure-Fire Trading Systems (VectorVest, Inc.)
- Trading as a Business Workshop
- VectorVest 7 EOD
- VectorVest 7 RealTime/IntraDay
- VectorVest AutoTester
- VectorVest Educational Services
- VectorVest OnLine
- VectorVest Options Analyzer
- VectorVest ProGraphics v6.0
- VectorVest ProTrader 7
- VectorVest RealTime Derby Tool
- VectorVest Simulator
- VectorVest Variator
- VectorVest Watchdog
