HOT TOPICS LIST
- MACD
- Fibonacci
- RSI
- Gann
- ADXR
- Stochastics
- Volume
- Triangles
- Futures
- Cycles
- Volatility
- ZIGZAG
- MESA
- Retracement
- Aroon
INDICATORS LIST
LIST OF TOPICS
PRINT THIS ARTICLE
by Donald W. Pendergast, Jr.
Of the 18 precious metals mining stocks that are outperforming their parent ETF over the past four weeks, none are stronger than shares of Golden Star Resources.
Position: N/A
Donald W. Pendergast, Jr.
Freelance financial markets writer and online publisher of the Trendzetterz.com S&P 500 Weekly Forecast service.
PRINT THIS ARTICLE
GSS Top Relative Strength Among Gold Miners
10/12/12 01:08:38 PMby Donald W. Pendergast, Jr.
Of the 18 precious metals mining stocks that are outperforming their parent ETF over the past four weeks, none are stronger than shares of Golden Star Resources.
Position: N/A
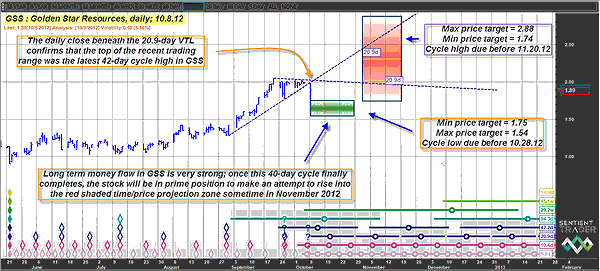
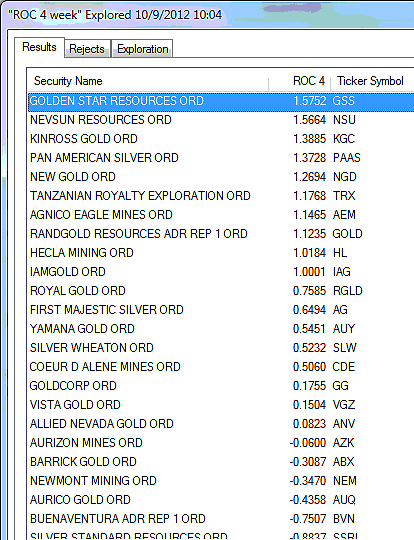
| Golden Star Resources (GSS) shares have far outperformed its parent exchange traded fund (ETF) GDX (Market Vectors Gold Miners) over the past month, even though the shares themselves are now enmeshed in some sort of a trading range or consolidation pause before attempting another run higher. The longer-term technicals still look very bullish in the stock, but the big question for traders and investors is whether the super-wide range, scary price action in GSS on Monday was a very fast drop and test of support -- with a bullish continuation move to soon appear -- or was it a precursor to a more noticeable drop into 40- and 80-day cycle support in the lower 1.50 area. See Figures 1, 2, and 3 for a closer look. |

|
| FIGURE 1: GSS, DAILY. While the dip down to the upper price range of the anticipated 40-day cycle low resulted in a strong intraday rebound on Monday, October 8, 2012, it's still highly probable that GSS will decline further and test the lower half of its anticipated cycle low price range between now and late October 2012. |
| Graphic provided by: Sentient Trader. |
| |
| GSS made a major multicycle low on May 22, 2012, finally bottoming out at $0.90 as eight consecutive price cycles (ranging from five days to 20 months in length) all exhausted their downward trajectories together. The massive rise up to the high of 2.05 on September 21, 2012, equated to a gain of 128%, with profit takers causing the stock to go mostly sideways for the last three weeks. A pause or period of consolidation after such a strong rally is entirely normal, allowing shares to exchange hands as a new round of potential buyers get set to take a shot on the potential for yet another rally. What is a bit abnormal, however, was the ultra wide range daily price bar on Monday, October 8, 2012, one that had a daily range of 23 cents -- nearly three times greater than the stock's 10-day average true range (ATR 10) figure of 0.084. The deep intraday dip actually brought GSS down to the very top of its 40-day cycle low price range (see green time/price/projection box), and in a hurry. At first glance it seems like this could technically qualify as a legit 40-day cycle low, but since the decline was so violent and chaotic, it makes more sense to wait a few trading sessions to see if the stock quiets down and gives some more clues as to its next move. Even if GSS does decide to move lower into the green zone, the stock's long-term money flow and strong relative strength attributes should cause it to have little difficulty in recruiting a new batch of profit-hungry gold bugs, traders eager to try and cash in on a possible continuation move in GSS into the red 40-day cycle high zone. |

|
| FIGURE 2: GSS. GSS has been outperforming its parent ETF (the Market Vectors Gold Miners) over the past four weeks. |
| Graphic provided by: MetaStock. |
| Graphic provided by: MetaStock Explorer. |
| |
| GSS is anticipated to bottom on its 40-and 80-day cycle between now and October 28, 2012, and is not projected to drop lower than 1.54 during that time window. If the stock catches another bid and breaks higher, the probabilities are good that GSS can launch into a new upswing, one that should peak no later than November 19, 2012, and at a price not greater than 2.88. As far as playing GSS right here, right now, it's probably best to stand aside and see what the near-term action in the precious metals group looks like. GSS may soon bottom and fire a mechanical buy signal, or it may just go sideways to slightly lower before finally exhausting the profit-taking pressures altogether. |

|
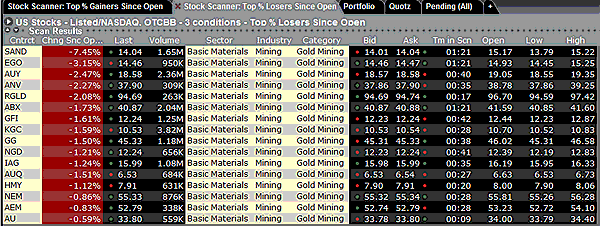
| FIGURE 3: PRECIOUS METALS. Precious metals stocks get hammered during the morning session on October 8, 2012. |
| Graphic provided by: Interactive Brokers TWS Market Scanner. |
| |
Freelance financial markets writer and online publisher of the Trendzetterz.com S&P 500 Weekly Forecast service.
| Title: | Market consultant and writer |
| Company: | Trendzetterz |
| Address: | 81 Hickory Hollow Drive |
| Crossville, TN 38555 | |
| Phone # for sales: | 904-303-4814 |
| Website: | trendzetterz.com |
| E-mail address: | support@trendzetterz.com |
Traders' Resource Links | |
| Trendzetterz has not added any product or service information to TRADERS' RESOURCE. | |
Click here for more information about our publications!
PRINT THIS ARTICLE

Request Information From Our Sponsors
- StockCharts.com, Inc.
- Candle Patterns
- Candlestick Charting Explained
- Intermarket Technical Analysis
- John Murphy on Chart Analysis
- John Murphy's Chart Pattern Recognition
- John Murphy's Market Message
- MurphyExplainsMarketAnalysis-Intermarket Analysis
- MurphyExplainsMarketAnalysis-Visual Analysis
- StockCharts.com
- Technical Analysis of the Financial Markets
- The Visual Investor
- VectorVest, Inc.
- Executive Premier Workshop
- One-Day Options Course
- OptionsPro
- Retirement Income Workshop
- Sure-Fire Trading Systems (VectorVest, Inc.)
- Trading as a Business Workshop
- VectorVest 7 EOD
- VectorVest 7 RealTime/IntraDay
- VectorVest AutoTester
- VectorVest Educational Services
- VectorVest OnLine
- VectorVest Options Analyzer
- VectorVest ProGraphics v6.0
- VectorVest ProTrader 7
- VectorVest RealTime Derby Tool
- VectorVest Simulator
- VectorVest Variator
- VectorVest Watchdog
