HOT TOPICS LIST
- MACD
- Fibonacci
- RSI
- Gann
- ADXR
- Stochastics
- Volume
- Triangles
- Futures
- Cycles
- Volatility
- ZIGZAG
- MESA
- Retracement
- Aroon
INDICATORS LIST
LIST OF TOPICS
PRINT THIS ARTICLE
by Donald W. Pendergast, Jr.
Having tested its 200-day exponential moving average three times since early August 2012, shares of Schlumberger Ltd. may be preparing for another swing higher into early November 2012.
Position: N/A
Donald W. Pendergast, Jr.
Freelance financial markets writer and online publisher of the Trendzetterz.com S&P 500 Weekly Forecast service.
PRINT THIS ARTICLE
SUPPORT & RESISTANCE
Schlumberger Support Test Under Way
10/11/12 12:52:43 PMby Donald W. Pendergast, Jr.
Having tested its 200-day exponential moving average three times since early August 2012, shares of Schlumberger Ltd. may be preparing for another swing higher into early November 2012.
Position: N/A
| Other than the precious metals mining stocks, perhaps the most volatile of all market industry groups are the oil services stocks, Even the large-cap stocks in this group are capable of making frequent -- and tradable -- swing and sustained trending moves. Right now, Schlumberger Ltd. (SLB), one of the giants in this industry group, appears to be close to completing a major test of its all-important 200-day exponential moving average (EMA), with other key technicals in agreement that the stock may be likely to move higher into early November 2012. Here's a closer look now. |

|
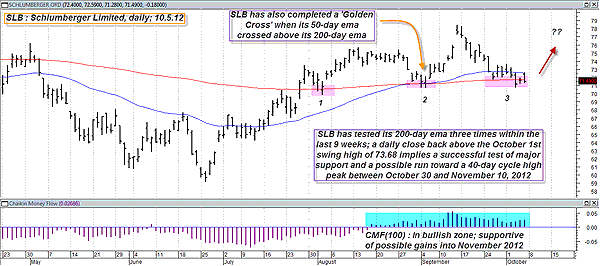
| FIGURE 1: SLB, DAILY. If SLB can manage to make a daily close above its recent swing high of 73.68, the third test of 200-day EMA support will be deemed a success, likely attracting plenty of new buying interest. Note that the stock's long-term money flow histogram remains in a bullish stance. |
| Graphic provided by: MetaStock. |
| |
| SLB made a major multicycle low on June 26, 2012, bottoming out at 59.12 before gaining new vigor. Within the following 10 weeks, the stock tacked on a maximum gain of 32.7% (on September 14, 2012), eventually pulling its 100-day Chaikin money flow histogram (CMF)(100) back above its zero line even as it made two successful tests of support at its 200-day EMA. While some technicians and traders may say that the 200-day EMA is an arbitrary number and is not any more significant than the 180- or 220-day EMA (who knows, they may be right, but only extensive testing can actually verify whether one moving average is more successful as a support level than another), it remains that a myriad number of traders, investors, and pro money managers routinely analyze a stock's performance by measuring its relation to its 200-day EMA. Since many of other market participants are paying close attention to this long-term trend delineating line on the charts, then perhaps it is a good idea to monitor it on our own trading screens as well. In the case of SLB's daily chart (Figure 1), we see that after it made the mid-September 2012 high of 78.47 that it once again declined to test the 200-day EMA for a third time and has been trading close to the EMA for the past two weeks. Long-term money flow remains in a bullish posture -- well above its zero line -- indicating that there is still plenty of buyer interest in this stock, with no evidence at all of any distribution in process. |

|
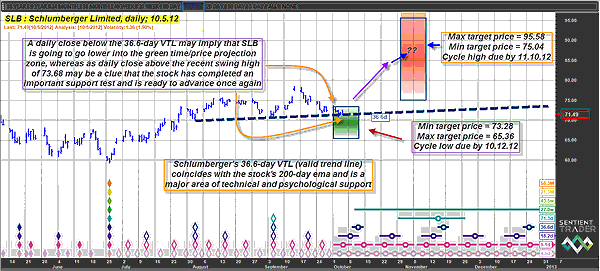
| FIGURE 2: SLB, DAILY. The red shaded area shows the anticipated time/price projection zone for SLB's nominal 40-day price cycle. |
| Graphic provided by: Sentient Trader. |
| |
| Since SLB looks attractive from a support/money flow viewpoint, what does its key trading cycle (the nominal 40-day cycle) have to say about SLB's prospects for another run higher in the near future? Actually, the outlook here is also of a bullish bias; note that SLB has already dipped into its projected time/price zone in which its 36.6-day cycle is expected to bottom and that it is also hugging its 36.6-day valid trendline (VTL) (Figure 2). The takeaway here is that if SLB can manage to soon rise above its most recent swing high of 73.68, the stock is most likely going to make a runup into the red zone depicted on the cycles chart. The 40-day nominal cycle high is anticipated to occur between October 30 and November 12, 2012, within the price range of 75.04 to 95.58. Conversely, a daily close below 70.72 may imply that SLB wants to test the lower portions of the green time/price zone before attempting a rebound. See Figure 3. |

|
| FIGURE 3: STOCK SCANNER. SLB trades higher in the morning session during October 8, 2012. |
| Graphic provided by: Interactive Brokers TWS Market Scanner. |
| |
| Playing a rise above 73.68 is simple. Just run a two-bar trailing stop of the daily lows until the final stopout and consider taking partial profits should the stock make it into the upper half of the red zone, just in case the anticipated rally isn't going to as strong as the cycles chart is suggesting. Keep your risk at 2% or less of your account value if you choose to trade this hypothetical setup and always keep a close eye on your positions once initiated. |
Freelance financial markets writer and online publisher of the Trendzetterz.com S&P 500 Weekly Forecast service.
| Title: | Market consultant and writer |
| Company: | Trendzetterz |
| Address: | 81 Hickory Hollow Drive |
| Crossville, TN 38555 | |
| Phone # for sales: | 904-303-4814 |
| Website: | trendzetterz.com |
| E-mail address: | support@trendzetterz.com |
Traders' Resource Links | |
| Trendzetterz has not added any product or service information to TRADERS' RESOURCE. | |
Click here for more information about our publications!
PRINT THIS ARTICLE

|

Request Information From Our Sponsors
- StockCharts.com, Inc.
- Candle Patterns
- Candlestick Charting Explained
- Intermarket Technical Analysis
- John Murphy on Chart Analysis
- John Murphy's Chart Pattern Recognition
- John Murphy's Market Message
- MurphyExplainsMarketAnalysis-Intermarket Analysis
- MurphyExplainsMarketAnalysis-Visual Analysis
- StockCharts.com
- Technical Analysis of the Financial Markets
- The Visual Investor
- VectorVest, Inc.
- Executive Premier Workshop
- One-Day Options Course
- OptionsPro
- Retirement Income Workshop
- Sure-Fire Trading Systems (VectorVest, Inc.)
- Trading as a Business Workshop
- VectorVest 7 EOD
- VectorVest 7 RealTime/IntraDay
- VectorVest AutoTester
- VectorVest Educational Services
- VectorVest OnLine
- VectorVest Options Analyzer
- VectorVest ProGraphics v6.0
- VectorVest ProTrader 7
- VectorVest RealTime Derby Tool
- VectorVest Simulator
- VectorVest Variator
- VectorVest Watchdog
