

HOT TOPICS LIST
- MACD
- Fibonacci
- RSI
- Gann
- ADXR
- Stochastics
- Volume
- Triangles
- Futures
- Cycles
- Volatility
- ZIGZAG
- MESA
- Retracement
- Aroon
INDICATORS LIST
LIST OF TOPICS
PRINT THIS ARTICLE
by Donald W. Pendergast, Jr.
When a stock's long-term money flow trend is deteriorating, wise traders and investors take notice.
Position: N/A
Donald W. Pendergast, Jr.
Freelance financial markets writer and online publisher of the Trendzetterz.com S&P 500 Weekly Forecast service.
PRINT THIS ARTICLE
CYCLES
BK Final Push To A Cycle High?
10/10/12 08:16:04 AMby Donald W. Pendergast, Jr.
When a stock's long-term money flow trend is deteriorating, wise traders and investors take notice.
Position: N/A
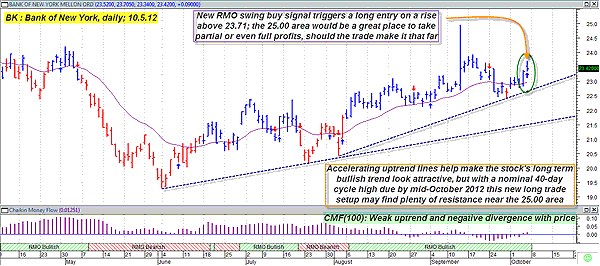
| Shares of Bank of New York Mellon (BK) enjoyed a steady, if modest amount of appreciation between June 4 and September 13, 2012, rising by 20% during that time. The stock is in a confirmed long-term uptrend, but its weakening money flow trend suggests that its current bullish swing may be the last one before a noticeable correction occurs (Figure 1). Here's a closer look now. |
|
| FIGURE 1: BK, DAILY. BK's solid uptrend is still in place, but its long-term money flow has been negatively diverging with price for the past 10 weeks, confirming that a steady distribution is under way. |
| Graphic provided by: MetaStock. |
| Graphic provided by: RMO trading system indicators from MetaStock 11. |
| |
| BK shares don't make gigantic trending moves like a Google (GOOG) or Apple (AAPL) can, but it can still make plenty of tradable swings that stock and option traders alike can profit from. Take the recent swing up from the major multicycle low of June 4, 2012, for example. There were several decent swing moves higher in the ensuing months, and with the stock now firing a new RMO (Rahul Mohindar) swing buy signal as its uptrend lines accelerate higher, the bulls are no doubt looking for another meaningful move to capitalize on. A rise above 23.71 (Friday's RMO signal day high) should unleash some more buying pressure in BK, with the stock very likely to make an attempt to reach the recent swing high of 24.95 sooner rather than later. However bullish all of this looks, the bulls still need to evaluate the technical state of BK's long-term money flow as well as its current price cycle action to really get a feel for how far BK may travel before it meets with an overhead supply (resistance) level. |
|
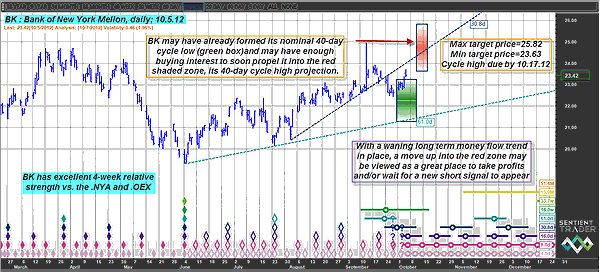
| FIGURE 2: BK, DAILY. If BK does actually make it into the red time/price projection zone soon, look for the 25.00 area to offer significant resistance as the 40-day cycle high seeks its high mark. |
| Graphic provided by: Sentient Trader. |
| |
| The money flow aspect is revealing. The 100-day Chaikin money flow (CMF)(100) histogram is in a very poor position to be offering much of a foundation for a powerful, sustained uptrend in BK right now; the histogram level is lower now than it was at either of the July and August 2012 swing highs in the stock, confirming steady distribution by the smart (or shall we say smarter) money interests in the market, and this is suggestive of an upcoming swing high in the stock. And from a price cycle perspective, BK appears to have already made a 40-day cycle low (green time/price projection box) and is now en route toward completing a 40-day cycle high (somewhere within the red time/price projection zone) sometime between October 11 and October 17, 2012. BK is expected to peak within the price range of 23.63 and 25.82 during that particular seven-day time window. BK is also outperforming the .NYA and .OEX on both a four- and 13-week basis (Figure 2), and that should also help to keep institutional interest in this stock high for the time being -- at least until it begins to get near 25.00, which should be a noticeable profit-taking zone for risk-averse traders who already know about the upcoming 40-day cycle high projection at a time of poor long-term money flow. See Figure 3 for swing buy signals. |
|
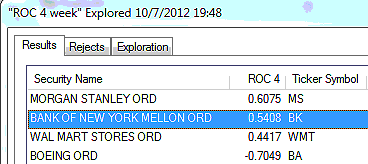
| FIGURE 3: SWING BUY SIGNALS. The .OEX component stocks firing RMO swing buy signals for Friday, October 5, 2012. |
| Graphic provided by: MetaStock. |
| Graphic provided by: MetaStock Explorer. |
| |
| The new buy signal is easy to play: 1. Place a buy-stop market order to go long on a rise above 23.71. 2. If filled, place an initial stop-loss (good till canceled) at 22.78 or so and begin running a two-bar trailing stop of the daily lows. 3. If the 24.95 area is reached, take at least half profits (if not all) and continue to run the trailing stop on any portion of the position you intend to hold for a larger gain. 4. Be sure to risk 2% or less of your account equity on this trade, regardless of how bullish you may be on BK's near-term prospects right now. |
Freelance financial markets writer and online publisher of the Trendzetterz.com S&P 500 Weekly Forecast service.
| Title: | Market consultant and writer |
| Company: | Trendzetterz |
| Address: | 81 Hickory Hollow Drive |
| Crossville, TN 38555 | |
| Phone # for sales: | 904-303-4814 |
| Website: | trendzetterz.com |
| E-mail address: | support@trendzetterz.com |
Traders' Resource Links | |
| Trendzetterz has not added any product or service information to TRADERS' RESOURCE. | |
Click here for more information about our publications!
PRINT THIS ARTICLE

Request Information From Our Sponsors
- StockCharts.com, Inc.
- Candle Patterns
- Candlestick Charting Explained
- Intermarket Technical Analysis
- John Murphy on Chart Analysis
- John Murphy's Chart Pattern Recognition
- John Murphy's Market Message
- MurphyExplainsMarketAnalysis-Intermarket Analysis
- MurphyExplainsMarketAnalysis-Visual Analysis
- StockCharts.com
- Technical Analysis of the Financial Markets
- The Visual Investor
- VectorVest, Inc.
- Executive Premier Workshop
- One-Day Options Course
- OptionsPro
- Retirement Income Workshop
- Sure-Fire Trading Systems (VectorVest, Inc.)
- Trading as a Business Workshop
- VectorVest 7 EOD
- VectorVest 7 RealTime/IntraDay
- VectorVest AutoTester
- VectorVest Educational Services
- VectorVest OnLine
- VectorVest Options Analyzer
- VectorVest ProGraphics v6.0
- VectorVest ProTrader 7
- VectorVest RealTime Derby Tool
- VectorVest Simulator
- VectorVest Variator
- VectorVest Watchdog