HOT TOPICS LIST
- MACD
- Fibonacci
- RSI
- Gann
- ADXR
- Stochastics
- Volume
- Triangles
- Futures
- Cycles
- Volatility
- ZIGZAG
- MESA
- Retracement
- Aroon
INDICATORS LIST
LIST OF TOPICS
PRINT THIS ARTICLE
by David Penn
Is Larry Ellison's software outfit headed for higher ground?
Position: N/A
David Penn
Technical Writer for Technical Analysis of STOCKS & COMMODITIES magazine, Working-Money.com, and Traders.com Advantage.
PRINT THIS ARTICLE
HEAD & SHOULDERS
Oracle's Head and Shoulders Bottom
07/15/02 12:44:07 PMby David Penn
Is Larry Ellison's software outfit headed for higher ground?
Position: N/A
| Times are tough for stocks -- and by some estimates, times are especially tough for technology stocks. Hardware or software, routers or RAM, motherboards or mobile phones -- it seems like the more a company benefited from the technological revolution of the second half of the 1990s, the more that company is required to "give back" ...in the form of lost equity value. The halving in value of shares of Oracle Corporation, which lost 50% in three months after breaking down in March, is in many ways a reminder to those who thought in the summer of 2000, or the summer of 2001, that the worst had already been done. |
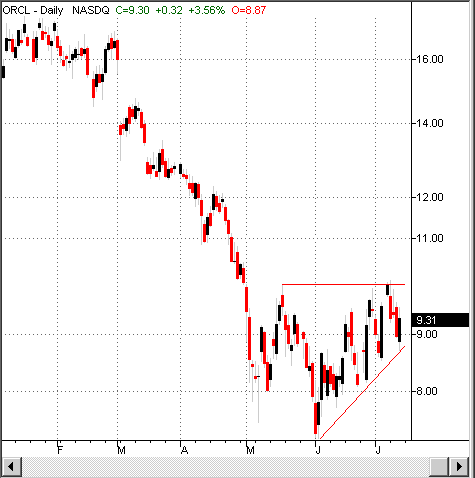
| But perhaps, at least for now, the worst may have been done to Oracle, which appears to have put in a bottom on June third at 7.27 and has since gained 28%. Even more interestingly, Oracle appears to be developing a head and shoulders bottom formation that could lead to even further advances. |

|
| This head and shoulders bottom in shares of Oracle Corporation could send prices to a test of the April highs just above 12. |
| Graphic provided by: TradeStation. |
| |
| The left shoulder of the Oracle Corporation head and shoulders bottom begins at the beginning of May and ends by mid-month, establishing a monthly high at 10 and the first third of the pattern. The head represents the resumption of the downtrend following that rally. It is in this part of the downtrend that Oracle makes its low of about 7.25, setting the stage for a rally and retest of the May highs. This test, which comes in late June, fails, and shares of Oracle begin moving down in early July. Nevertheless, note that the correction lows in June and July are progressively higher. The final, right-side shoulder of the head and shoulders pattern is in this pattern of higher lows (actually, prices equally bound by an upward trend channel in June and July). |
| Given a formation size of 2.75 (formation height less value at formation bottom) and a breakout "neckline" of 10, a successful breakout from this head and shoulders bottom could send ORCL as high as 12 or 13, providing a major retest of the April highs. Resistance at 14 remains formidable in any event -- the correction lows of the fall of 2001 being the culprit -- thus gains much beyond this point would indeed be exceptional. But should a brief, relief rally come at the end of several days of declines in the market averages, might not Ellison's Oracle be a beneficiary? |
Technical Writer for Technical Analysis of STOCKS & COMMODITIES magazine, Working-Money.com, and Traders.com Advantage.
| Title: | Technical Writer |
| Company: | Technical Analysis, Inc. |
| Address: | 4757 California Avenue SW |
| Seattle, WA 98116 | |
| Phone # for sales: | 206 938 0570 |
| Fax: | 206 938 1307 |
| Website: | www.Traders.com |
| E-mail address: | DPenn@traders.com |
Traders' Resource Links | |
| Charting the Stock Market: The Wyckoff Method -- Books | |
| Working-Money.com -- Online Trading Services | |
| Traders.com Advantage -- Online Trading Services | |
| Technical Analysis of Stocks & Commodities -- Publications and Newsletters | |
| Working Money, at Working-Money.com -- Publications and Newsletters | |
| Traders.com Advantage -- Publications and Newsletters | |
| Professional Traders Starter Kit -- Software | |
Click here for more information about our publications!
Comments
Date: 07/16/02Rank: 5Comment:

Request Information From Our Sponsors
- VectorVest, Inc.
- Executive Premier Workshop
- One-Day Options Course
- OptionsPro
- Retirement Income Workshop
- Sure-Fire Trading Systems (VectorVest, Inc.)
- Trading as a Business Workshop
- VectorVest 7 EOD
- VectorVest 7 RealTime/IntraDay
- VectorVest AutoTester
- VectorVest Educational Services
- VectorVest OnLine
- VectorVest Options Analyzer
- VectorVest ProGraphics v6.0
- VectorVest ProTrader 7
- VectorVest RealTime Derby Tool
- VectorVest Simulator
- VectorVest Variator
- VectorVest Watchdog
- StockCharts.com, Inc.
- Candle Patterns
- Candlestick Charting Explained
- Intermarket Technical Analysis
- John Murphy on Chart Analysis
- John Murphy's Chart Pattern Recognition
- John Murphy's Market Message
- MurphyExplainsMarketAnalysis-Intermarket Analysis
- MurphyExplainsMarketAnalysis-Visual Analysis
- StockCharts.com
- Technical Analysis of the Financial Markets
- The Visual Investor
