HOT TOPICS LIST
- MACD
- Fibonacci
- RSI
- Gann
- ADXR
- Stochastics
- Volume
- Triangles
- Futures
- Cycles
- Volatility
- ZIGZAG
- MESA
- Retracement
- Aroon
INDICATORS LIST
LIST OF TOPICS
PRINT THIS ARTICLE
by Koos van der Merwe
No pattern is a perfect buy or sell pattern, especially when the "Buy on rumor and sell on fact" takes precedence.
Position: Accumulate
Koos van der Merwe
Has been a technical analyst since 1969, and has worked as a futures and options trader with First Financial Futures in Johannesburg, South Africa.
PRINT THIS ARTICLE
HEAD & SHOULDERS
Failed Inverse Head & Shoulders
10/08/12 09:35:35 AMby Koos van der Merwe
No pattern is a perfect buy or sell pattern, especially when the "Buy on rumor and sell on fact" takes precedence.
Position: Accumulate
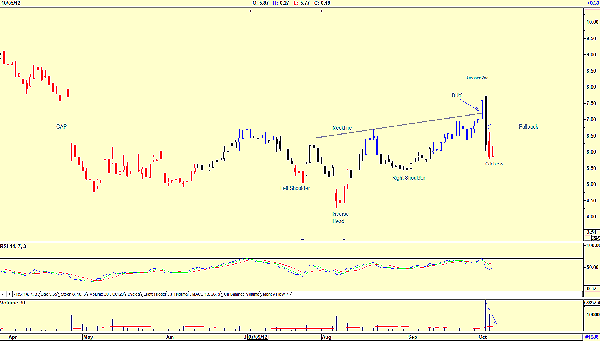
| Patterns in technical analysis are very popular because they are more often than not repetitive. Every now and then, however, a buy or sell signal given by a reliable pattern tends to fail. The chart of LEAP Wireless (LEAP) shows a pattern that failed over the past week (Figure 1). The inverse head & shoulder formation is one of the most common and also one of the most reliable of all major reversal patterns. It consists of a left shoulder, a head, and a right shoulder. The left shoulder is usually formed at the end of an extensive fall, during which volume is quite heavy. At the end of the left shoulder, there is usually a small rise, which typically occurs on low volume. The inverse head then forms on heavy volume, with lesser volume accompanying the subsequent reaction. At this point, in order to conform to proper form, prices must rise to somewhere near the high of the left shoulder. The right shoulder is then formed by a fall on usually less volume than previously. A neckline can be drawn across the tops of the left shoulder, the inverse head, and the right shoulder. Breaking this neckline on a rise from the right shoulder is a final confirmation and completes the inverse head & shoulders formation. This is then a signal to buy. Occasionally, after moving higher above the neckline, prices do tend to fall, pulling back to the neckline and occasionally even below the neckline before continuing to rise. This pullback can be used to add to the original position. |

|
| FIGURE 1: LEAP, DAILY. Here's the daily chart of LEAP showing the inverse head & shoulder pattern. |
| Graphic provided by: AdvancedGET. |
| |
| In Figure 1, we can see the inverse head & shoulder pattern of LEAP. Note the inverse head & shoulder pattern that developed and the buy signal given as the price broke the neckline on October 2. A major reversal occurred on October 3, as the rumor of an impending buyout did not occur. The price fell dramatically and only started suggesting a recovery on October 5. Note how volume started falling after the heavy volume of October 5, suggesting a sign of strength ahead. |

|
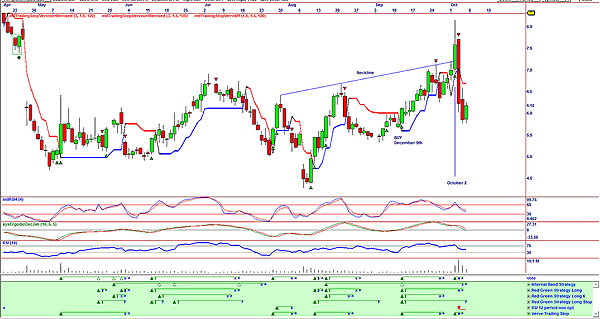
| FIGURE 2: LEAP, DAILY. Here's a daily chart showing vote line buy followed by a stop. |
| Graphic provided by: OmniTrader. |
| |
| Figure 2 shows the buy signal given on December 9 by the vote line, a signal repeated on October 2, which was stopped out as the price fell on October 3. Note also that the four-period relative strength index (RSI) gave a sell signal on October 2 and is trending down, as is the 14-period RSI. Because of the inverse head & shoulder pattern, I would have bought the share as it broke above the neckline, and it was stopped out on October 3 for a loss. However, because of the reliability of the pattern, I shall be watching the share and buying back into it as the share price rises. |
Has been a technical analyst since 1969, and has worked as a futures and options trader with First Financial Futures in Johannesburg, South Africa.
| Address: | 3256 West 24th Ave |
| Vancouver, BC | |
| Phone # for sales: | 6042634214 |
| E-mail address: | petroosp@gmail.com |
Click here for more information about our publications!
PRINT THIS ARTICLE

Request Information From Our Sponsors
- StockCharts.com, Inc.
- Candle Patterns
- Candlestick Charting Explained
- Intermarket Technical Analysis
- John Murphy on Chart Analysis
- John Murphy's Chart Pattern Recognition
- John Murphy's Market Message
- MurphyExplainsMarketAnalysis-Intermarket Analysis
- MurphyExplainsMarketAnalysis-Visual Analysis
- StockCharts.com
- Technical Analysis of the Financial Markets
- The Visual Investor
- VectorVest, Inc.
- Executive Premier Workshop
- One-Day Options Course
- OptionsPro
- Retirement Income Workshop
- Sure-Fire Trading Systems (VectorVest, Inc.)
- Trading as a Business Workshop
- VectorVest 7 EOD
- VectorVest 7 RealTime/IntraDay
- VectorVest AutoTester
- VectorVest Educational Services
- VectorVest OnLine
- VectorVest Options Analyzer
- VectorVest ProGraphics v6.0
- VectorVest ProTrader 7
- VectorVest RealTime Derby Tool
- VectorVest Simulator
- VectorVest Variator
- VectorVest Watchdog
