HOT TOPICS LIST
- MACD
- Fibonacci
- RSI
- Gann
- ADXR
- Stochastics
- Volume
- Triangles
- Futures
- Cycles
- Volatility
- ZIGZAG
- MESA
- Retracement
- Aroon
INDICATORS LIST
LIST OF TOPICS
PRINT THIS ARTICLE
by Donald W. Pendergast, Jr.
Shares of Google have soared since mid-June 2012, up by more than 38%. But an important swing high may be approaching, one that could cause a significant correction.
Position: N/A
Donald W. Pendergast, Jr.
Freelance financial markets writer and online publisher of the Trendzetterz.com S&P 500 Weekly Forecast service.
PRINT THIS ARTICLE
CYCLES
Google Approaching A Major Multicycle High?
10/09/12 09:02:01 AMby Donald W. Pendergast, Jr.
Shares of Google have soared since mid-June 2012, up by more than 38%. But an important swing high may be approaching, one that could cause a significant correction.
Position: N/A
| Google (GOOG) is one of those companies that just never seems to run out of creative ideas. They revolutionized the search engine business, and their Android operating system (OS) for mobile communication devices continues to connect the world (more than 68% of all smart phones use the Android OS) in ever more effective and efficient ways. The stock is a darling of momentum traders as well as longer-term money managers and always seems to be in the news. Right now, though, some of the biggest technical news isn't coming from Wall Street or Mountainview, CA (Google's HQ), but from various technical charting and cycle analysis software platforms that are confirming that GOOG's recent 16-week rally is very close to reaching its ultimate high prior to a major correction. Here's a closer look now. See Figure 1. |

|
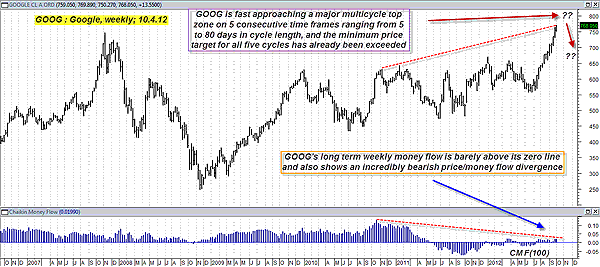
| FIGURE 1: GOOG, WEEKLY. GOOG's weekly long-term money flow trend is downright scary, enough so that existing longs in the stock should immediately consider taking some profits, running closer stops, and/or buying protective put options. |
| Graphic provided by: MetaStock. |
| |
| GOOG made a significant multicycle low on June 14, 2012, at 556.52 and then briefly consolidated for a couple of weeks before launching into its current, massive rally. The stock is up by nearly 40% in only 16 weeks and hasn't once closed beneath its 13-day exponential moving average (EMA) (a great intermediate-term trend delineator) since July 17, 2012. The stock is trading at all-time highs, and the trend on its daily chart looks bullish. But a deeper technical evaluation of GOOG reveals that there is a severe structural crack in the framework of this rally, one that is strongly suggesting that the stock is heading for a tumble sometime during the next five weeks. That major flaw is called negative price/money flow divergence, and the one that GOOG's weekly chart is manifesting is ultra-bearish; look at how high the Chaikin money flow (CMF)(100) histogram was at the stock's November 2010 swing high and then look and see how minuscule the recent histogram high is as GOOG powered up close to the 770.00 level on October 4, 2012. The difference is massive, and it is proof positive that the smart money has been selling their shares of the stock to lesser-informed latecomers -- the ones currently driving up the price, albeit on dramatically smaller volume levels. By all means, if you intend to establish a long-term position in GOOG, wait for a major pullback rather than try to jump in now near a major top. |

|
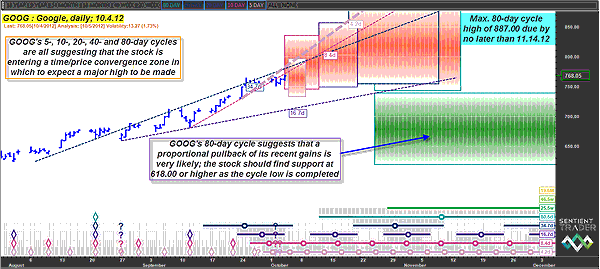
| FIGURE 2: GOOG, DAILY. No fewer than five consecutive price cycles in GOOG are warning of a fast-approaching multicycle high sometime during the next few weeks. |
| Graphic provided by: Sentient Trader. |
| |
| The second technical red flag is the cycle studies output on GOOG; no less than five consecutive cycles are in agreement that a major cycle high is forming or is soon to be close to completion (Figure 2). The shortest cycle's time/price projection for its next high is shown on the left, followed by the 10-, 20-, 40-, and 80-day cycles (all shaded in red). While it's impossible to know what the exact high will be for this astounding run, much less the actual day of the ultimate peak, the cycles evidence clearly suggests that GOOG is much closer to the end of its June to October 2012 rally than it is to its start. Note also that while GOOG could still rise as high as 887.00 by November 14, 2012, that it has already -- on five consecutive time frames -- exceeded the minimum price target on every single one of those five price cycles. |
| Longer term, we also find that GOOG is projected to decline noticeably from its upcoming multicycle high, possibly falling well into the lower half of the 600.00 price range between late October and mid-December 2012 (green shaded zone). This is based on the 80-day cycle; lower-degree cycles may form their own swing lows in the upper range of that particular zone. If you are long GOOG right now, you need to either be scaling out of profitable trades or running closer trailing stops or buying protective puts. The reversal at the ultimate top of this terrific rally could be sharp, swift, and relatively unexpected (for the average trader -- unlike yourself, now that you are aware of GOOG's true technical stance), so make sure you have a solid defense for your long GOOG positions all ready to go. |
Freelance financial markets writer and online publisher of the Trendzetterz.com S&P 500 Weekly Forecast service.
| Title: | Market consultant and writer |
| Company: | Trendzetterz |
| Address: | 81 Hickory Hollow Drive |
| Crossville, TN 38555 | |
| Phone # for sales: | 904-303-4814 |
| Website: | trendzetterz.com |
| E-mail address: | support@trendzetterz.com |
Traders' Resource Links | |
| Trendzetterz has not added any product or service information to TRADERS' RESOURCE. | |
Click here for more information about our publications!
PRINT THIS ARTICLE

|

Request Information From Our Sponsors
- StockCharts.com, Inc.
- Candle Patterns
- Candlestick Charting Explained
- Intermarket Technical Analysis
- John Murphy on Chart Analysis
- John Murphy's Chart Pattern Recognition
- John Murphy's Market Message
- MurphyExplainsMarketAnalysis-Intermarket Analysis
- MurphyExplainsMarketAnalysis-Visual Analysis
- StockCharts.com
- Technical Analysis of the Financial Markets
- The Visual Investor
- VectorVest, Inc.
- Executive Premier Workshop
- One-Day Options Course
- OptionsPro
- Retirement Income Workshop
- Sure-Fire Trading Systems (VectorVest, Inc.)
- Trading as a Business Workshop
- VectorVest 7 EOD
- VectorVest 7 RealTime/IntraDay
- VectorVest AutoTester
- VectorVest Educational Services
- VectorVest OnLine
- VectorVest Options Analyzer
- VectorVest ProGraphics v6.0
- VectorVest ProTrader 7
- VectorVest RealTime Derby Tool
- VectorVest Simulator
- VectorVest Variator
- VectorVest Watchdog
