HOT TOPICS LIST
- MACD
- Fibonacci
- RSI
- Gann
- ADXR
- Stochastics
- Volume
- Triangles
- Futures
- Cycles
- Volatility
- ZIGZAG
- MESA
- Retracement
- Aroon
INDICATORS LIST
LIST OF TOPICS
PRINT THIS ARTICLE
by Billy Williams
Candlesticks can help you pick low-risk trade setups, especially when using other indicators as filters.
Position: Hold
Billy Williams
Billy Williams has been trading the markets for 27 years, specializing in momentum trading with stocks and options.
PRINT THIS ARTICLE
CANDLESTICK CHARTING
Swing Trading With Engulfing Patterns
10/05/12 12:04:51 PMby Billy Williams
Candlesticks can help you pick low-risk trade setups, especially when using other indicators as filters.
Position: Hold
| Around 1850 Japan, the merchant class would trade in rice and commodities using a form of technical analysis called candlesticks. Like modern price bars, the candlestick bars would have an open, high, low, and close, but the body of the price bar would be filled with color to give a strong visual representation of the corresponding price action. The area filled would be between the price opening and close with any intraday high or low marked by a thin line and referred to as the "shadow" portion of the candlestick price bar. The Japanese traders believed that price patterns could reveal themselves better from the strong visual representation of the price action. The longer the body of the candlestick bar, the more intense the buying or selling was represented. For the shadow portion of candlestick price bars, the longer the line was and the greater the indication that buyers or sellers were lurking at the price levels that the shadow's price action was trading at and driving prices back. |

|
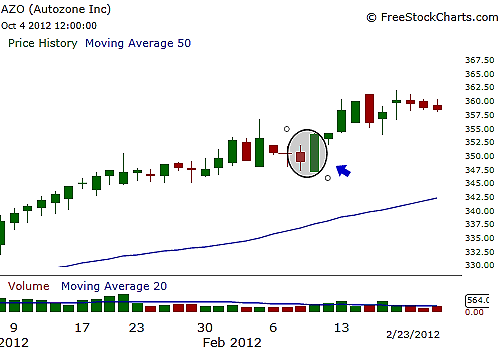
| FIGURE 1: AZO, DAILY. On February 9, 2012, an engulfing candlestick price bar formed as the 50-day SMA was trending upward. The formation of such a pattern set up a low-risk trade once price traded over the high of the engulfing bar. |
| Graphic provided by: www.freestockcharts.com. |
| |
| If the shadow portion was short, then the indication was that price was closely tied to the body of the bar and trading was focused within that range. With that foundation, price patterns would form where the merchants could detect where price would likely reverse and/or they could make an easy entry into the underlying security to gain a good price and profit. Some of these patterns have evolved to the point of being subjective and overly esoteric, but there are some reliable candlestick patterns that can serve you well, especially if you are trading with other indicators like moving averages and Bollinger Bands. A solid pattern to look for when trading candlestick patterns is the engulfing bar (Figure 1). This bar consists of two candlestick price bars with the first day trading in a narrow range that closes down for the day. The sellers are still in control of the stock, but because the stock was trading in a narrow, tight range it means the volatility was low, and as a result, the sellers are not very aggressive. |
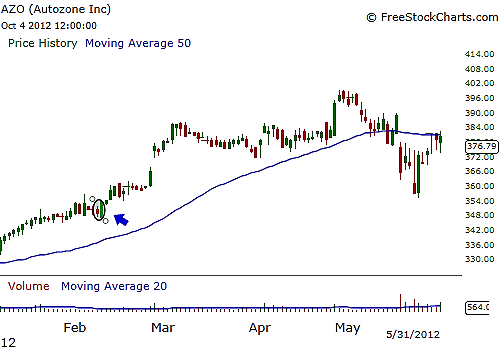
| However, on the second day, buyers enter the market en masse and shake the sellers up when they make a play for control of the price action, which causes the day's price action to trade outside the previous candlestick's high and low, engulfing the bar's price range. This type of price bar is a reversal pattern and is a strong indicator that the other side has entered the market with the intention of wrestling control away from the other side. The reason that this pattern is so valuable to you is that when you combine it with another indicator as a filter, it helps you zero in on low-risk setups in the direction of the dominant trend. By doing this, you lower your overall risk while increasing your expectancy per trade, or your average profit over the long run by increasing your risk/reward ratio over time. See Figure 2. |

|
| FIGURE 2: AZO. AZO went on to gain almost 44 points from the time that the trade entry was signaled, a potential gain of just under 13% in less than three months. |
| Graphic provided by: www.freestockcharts.com. |
| |
| For example, if you use a 50-day SMA (simple moving average) that is sloping upward while looking for potential engulfing bar patterns to enter into as price pulls back, then you put yourself in front of the trend in play while using a high-probability reversal pattern to enter in the direction of that trend's movement. This pattern can be used with any price action whether it is a stock, index, currency, forex, or other underlying security but always use stops to protect yourself if price fails to gather the necessary strength in your preferred direction. For profits, you can exit entirely at a selected profit target; better, sell half and then use a trailing stop as price continues in your preferred direction. |
Billy Williams has been trading the markets for 27 years, specializing in momentum trading with stocks and options.
| Company: | StockOptionSystem.com |
| E-mail address: | stockoptionsystem.com@gmail.com |
Traders' Resource Links | |
| StockOptionSystem.com has not added any product or service information to TRADERS' RESOURCE. | |
Click here for more information about our publications!
Comments

Request Information From Our Sponsors
- VectorVest, Inc.
- Executive Premier Workshop
- One-Day Options Course
- OptionsPro
- Retirement Income Workshop
- Sure-Fire Trading Systems (VectorVest, Inc.)
- Trading as a Business Workshop
- VectorVest 7 EOD
- VectorVest 7 RealTime/IntraDay
- VectorVest AutoTester
- VectorVest Educational Services
- VectorVest OnLine
- VectorVest Options Analyzer
- VectorVest ProGraphics v6.0
- VectorVest ProTrader 7
- VectorVest RealTime Derby Tool
- VectorVest Simulator
- VectorVest Variator
- VectorVest Watchdog
- StockCharts.com, Inc.
- Candle Patterns
- Candlestick Charting Explained
- Intermarket Technical Analysis
- John Murphy on Chart Analysis
- John Murphy's Chart Pattern Recognition
- John Murphy's Market Message
- MurphyExplainsMarketAnalysis-Intermarket Analysis
- MurphyExplainsMarketAnalysis-Visual Analysis
- StockCharts.com
- Technical Analysis of the Financial Markets
- The Visual Investor
