HOT TOPICS LIST
- MACD
- Fibonacci
- RSI
- Gann
- ADXR
- Stochastics
- Volume
- Triangles
- Futures
- Cycles
- Volatility
- ZIGZAG
- MESA
- Retracement
- Aroon
INDICATORS LIST
LIST OF TOPICS
PRINT THIS ARTICLE
by Billy Williams
You can increase your odds of adapting your strategy to the market type in effect.
Position: Buy
Billy Williams
Billy Williams has been trading the markets for 27 years, specializing in momentum trading with stocks and options.
PRINT THIS ARTICLE
STRATEGIES
Market Types, Sideways Markets, And Trading With Bollinger Bands
10/04/12 08:41:36 AMby Billy Williams
You can increase your odds of adapting your strategy to the market type in effect.
Position: Buy
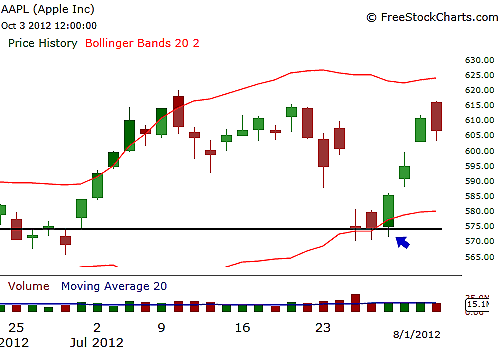
| In today's stock market, it takes a greater degree of skill to make outsized returns than in markets of the past, but the good news is that you can put the odds in your favor by being able to identify market types and matching the appropriate strategy to that market type. There are three market types that exist in the market at any given time: bullish, bearish, and sideways markets. Currently, the market type can be classified as a sideways one that is leaning toward the bullish market. However, it is important to note that the market is usually range-bound to some degree, which makes the sideways market the most common market type to familiarize yourself with. In addition, when the market type is classified as bullish or bearish, then it has a natural bias to trend in a steady series of new highs and lows before reaching a tipping point where price will reach an extreme during the movement of its trend. It is at these extreme price points where price is likely to reverse and change direction. See Figure 1. |

|
| FIGURE 1: AAPL. On July 25, 2012, Apple Inc. stock traded below its lower Bollinger Band, setting the condition for a long entry as price traded beyond its established volatility level. |
| Graphic provided by: www.freestockcharts.com. |
| |
| In a sideways market, price tends to ebb and flow between two price points that are static once they establish support and resistance price levels. It is between support and resistance where the opportunity lies for the average trader, but greater opportunity lies by looking for reliable setups where the average trader is not looking. Like a good magician, price action forms the illusion of easy money by trading off of support and resistance price points, and there are a lot of traders who make incredible returns trading traditional support/resistance points. But to take your trading to a higher, more meaningful level, you need to strive beyond the obvious and become more than "average." |

|
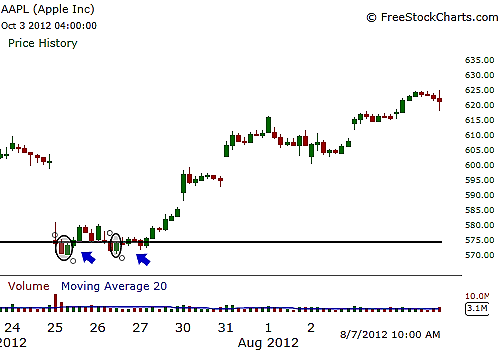
| FIGURE 2: AAPL, HOURLY. By chunking down to the 60-minute chart, you could observe price reversal setups forming from the candlestick patterns along the price movement that occurred at the lower Bollinger Band, creating a strong low-risk setup as price reverted back to its mean to the upside. |
| Graphic provided by: www.freestockcharts.com. |
| |
| Using Bollinger Bands, you see where price moves dynamically between support/resistance points established not by static price levels but based on the underlying security's volatility. The key point about volatility, and why it can be so valuable to you during a sideways market, is that by watching for price to reach extreme levels in its movement when it reaches beyond the support/resistance bands, you have reliable trade setups that can offer you quick returns at lower levels of risk. When you overlay the Bollinger Bands on a price chart, set the readings at the 20 level so that the indicator can take into account the last 20 days' worth of volatility readings to establish the band levels that act as support and resistance. But you're not looking to the bands for common support/resistance entry points to make your trade decisions because the setup occurs when price trades beyond the trading band's levels. |
| When trading with volatility, it's important to be aware of the underlying principle of the trade setup in that volatility reverts to the mean, meaning that when price trades beyond its 20-day volatility average, it has a natural bias to snap back to the median price line of the Bollinger Band indicator. So if a stock trades 1% or more past either upper or lower Bollinger Band, then that is an indicator that a price reversal is likely to follow as price trades back to the mean. On daily charts, you can use this setup for quick one- to seven-day price snapbacks using either stocks or options. For daytraders, you can use the daily charts to spot the setup, then chunk down to the five-minute of 60-minute charts to time your entries using candlestick bars as they form reversal patterns (Figure 2). Using this setup condition can help you gain a quick 1% to 6% on each trade with lower risk, but always use stop-loss orders to protect your downside. |
Billy Williams has been trading the markets for 27 years, specializing in momentum trading with stocks and options.
| Company: | StockOptionSystem.com |
| E-mail address: | stockoptionsystem.com@gmail.com |
Traders' Resource Links | |
| StockOptionSystem.com has not added any product or service information to TRADERS' RESOURCE. | |
Click here for more information about our publications!
Comments

Request Information From Our Sponsors
- StockCharts.com, Inc.
- Candle Patterns
- Candlestick Charting Explained
- Intermarket Technical Analysis
- John Murphy on Chart Analysis
- John Murphy's Chart Pattern Recognition
- John Murphy's Market Message
- MurphyExplainsMarketAnalysis-Intermarket Analysis
- MurphyExplainsMarketAnalysis-Visual Analysis
- StockCharts.com
- Technical Analysis of the Financial Markets
- The Visual Investor
- VectorVest, Inc.
- Executive Premier Workshop
- One-Day Options Course
- OptionsPro
- Retirement Income Workshop
- Sure-Fire Trading Systems (VectorVest, Inc.)
- Trading as a Business Workshop
- VectorVest 7 EOD
- VectorVest 7 RealTime/IntraDay
- VectorVest AutoTester
- VectorVest Educational Services
- VectorVest OnLine
- VectorVest Options Analyzer
- VectorVest ProGraphics v6.0
- VectorVest ProTrader 7
- VectorVest RealTime Derby Tool
- VectorVest Simulator
- VectorVest Variator
- VectorVest Watchdog
