HOT TOPICS LIST
- MACD
- Fibonacci
- RSI
- Gann
- ADXR
- Stochastics
- Volume
- Triangles
- Futures
- Cycles
- Volatility
- ZIGZAG
- MESA
- Retracement
- Aroon
INDICATORS LIST
LIST OF TOPICS
PRINT THIS ARTICLE
by Donald W. Pendergast, Jr.
Here's a brief tutorial on how to identify short-term momentum trade setups in a basket of gold mining stocks.
Position: N/A
Donald W. Pendergast, Jr.
Freelance financial markets writer and online publisher of the Trendzetterz.com S&P 500 Weekly Forecast service.
PRINT THIS ARTICLE
STRATEGIES
Scanning For Big Intraday Gainers/Losers
10/05/12 08:23:33 AMby Donald W. Pendergast, Jr.
Here's a brief tutorial on how to identify short-term momentum trade setups in a basket of gold mining stocks.
Position: N/A
| Trading systems can be simple mechanical models that rely on perhaps one to three ordinary technical triggers, or they can be based on elaborate quantitative analysis-based frameworks that rely on dozens of inputs. Having developed and implemented many stock and futures trading systems since the late 1990s, I am definitely of the persuasion that "simpler is better." Here's a look at a simple system, one that can help you time short-term momentum entries into gold stocks, using a basic combination of a daily chart and an intraday market scanner. Let's take a look at it right now. |

|
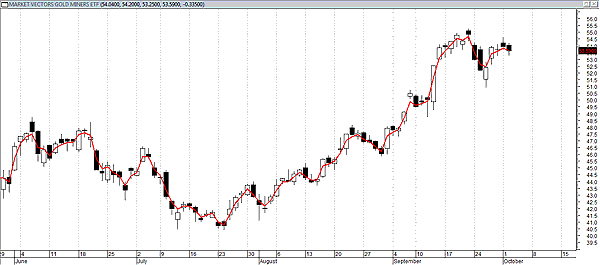
| FIGURE 1: GDX, DAILY. By monitoring GDX's daily closes above/beneath a short-term moving average, intraday gold stock traders can verify shifts in momentum that can lead to profitable next-day intraday trading opportunities. |
| Graphic provided by: MetaStock. |
| |
| Figure 1 is a daily view of the Market Vectors Gold Miners exchange traded fund (ETF) (GDX) and is overlaid with a two-day exponential moving average (EMA). GDX closed beneath this EMA on Tuesday, October 2, 2012, and made an intraday low of 53.25. It's not necessarily a major sell signal by any means, but it does show some modest downside momentum, and if the low of 53.25 is soon exceeded, it could lead to more substantial selling (and potential profits for short sellers and long put buyers). So, what we want to do is monitor GDX on our intraday charting software and watch for the 53.25 area to be hit again. My own testing has shown that there is a high probability of at least a 0.75% to 1% price move in the direction of such a breakdown (breakout) move beyond the low (high) established on the same day that GDX makes a daily close below(above) its two-day EMA. While we can simply just place a sell-stop market order for GDX a few ticks below 53.25 (immediately placing a stop-loss above Wednesday's opening price of 54.20 if filled) and hold on for a 0.75% to 1% profit target, it might be even more profitable to monitor some of GDX's component stocks and see if they have also: 1. Closed below their own two-day EMA 2. And are approaching their Tuesday intraday lows. Some of GDX's component stocks are extremely high-beta issues that travel farther and faster than their parent ETF, and the big idea here is to buy/sell those that are manifesting the most intraday strength/weakness on the day that the above conditions are met. If we use modest profit targets (similar to those in GDX of 0.75% to 1%) on the high-beta stocks that make the cut, we should have an even higher probability of achieving a low-risk, momentum-driven profit. The high-beta gold mining stocks will frequently make their individual move before GDX does, thus permitting savvy, mindful traders to capitalize on emerging momentum plays before the average trader does. |

|
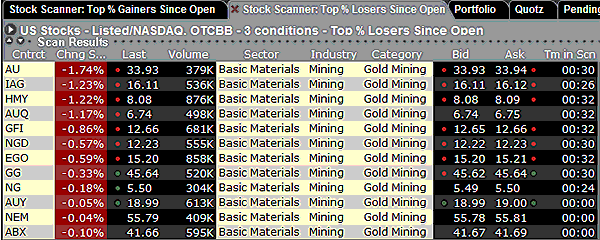
| FIGURE 2: STOCK SCANNER. A variety of gold miners were down noticeably during the morning session on Wednesday, October 3, 2012. |
| Graphic provided by: Interactive Brokers TWS Market Scanner. |
| |
| Using the Interactive Brokers Traders Workstation (TWS) stock scanner (Figures 2 and 3), we can easily find which gold stocks are down the most the day after GDX makes a daily close below its two-day EMA, without even waiting for GDX to follow through. At 10:15 Eastern time (ET), we find that AngloGold Ashanti (AU) was down by 1.74% from its opening price and had already breached its own two-day EMA and prior day's low of 34.17. If you had placed a sell-stop market order at 34.16 and then a buy limit order at 33.81 (a 1% profit target), you would have been filled at 9:38 ET, reaching your profit target on this short-term momentum play by 10:34 ET. Shares of AU went even lower in the morning session, falling to 33.58 before support finally kicked in at about 10:50 ET. The fourth stock on the scanner list (AUQ) also offered a successful, 1% target short sale, using the exact same entry criteria used for the AU trade. |

|
| FIGURE 3: STOCK SCANNER. While this TWS market scanner is specifically configured to seek out the "Top % losers since open" among gold mining stocks, you can easily change it to monitor stocks from any sector or industry group you desire. |
| Graphic provided by: Interactive Brokers TWS Market Scanner. |
| |
| Configuring the TWS to seek out the biggest decliners since the trading session's open is very easy. The chart image will show you all of the basic setup parameters. You'll also want to set up a daily chart with a two-day EMA of GDX and of GDX's components, monitoring them for daily closes above their respective two-day EMAs. By keeping tabs of the shifts in momentum in GDX and its key high-beta components, you can now be prepared to pounce on developing short-term momentum situations in one of the most volatile of all market industry groups. Be sure to limit you risk on these kinds of trades to 1% or less of your account value, particularly if taking the short side of the market. |
Freelance financial markets writer and online publisher of the Trendzetterz.com S&P 500 Weekly Forecast service.
| Title: | Market consultant and writer |
| Company: | Trendzetterz |
| Address: | 81 Hickory Hollow Drive |
| Crossville, TN 38555 | |
| Phone # for sales: | 904-303-4814 |
| Website: | trendzetterz.com |
| E-mail address: | support@trendzetterz.com |
Traders' Resource Links | |
| Trendzetterz has not added any product or service information to TRADERS' RESOURCE. | |
Click here for more information about our publications!
Comments

Request Information From Our Sponsors
- StockCharts.com, Inc.
- Candle Patterns
- Candlestick Charting Explained
- Intermarket Technical Analysis
- John Murphy on Chart Analysis
- John Murphy's Chart Pattern Recognition
- John Murphy's Market Message
- MurphyExplainsMarketAnalysis-Intermarket Analysis
- MurphyExplainsMarketAnalysis-Visual Analysis
- StockCharts.com
- Technical Analysis of the Financial Markets
- The Visual Investor
- VectorVest, Inc.
- Executive Premier Workshop
- One-Day Options Course
- OptionsPro
- Retirement Income Workshop
- Sure-Fire Trading Systems (VectorVest, Inc.)
- Trading as a Business Workshop
- VectorVest 7 EOD
- VectorVest 7 RealTime/IntraDay
- VectorVest AutoTester
- VectorVest Educational Services
- VectorVest OnLine
- VectorVest Options Analyzer
- VectorVest ProGraphics v6.0
- VectorVest ProTrader 7
- VectorVest RealTime Derby Tool
- VectorVest Simulator
- VectorVest Variator
- VectorVest Watchdog
