HOT TOPICS LIST
- MACD
- Fibonacci
- RSI
- Gann
- ADXR
- Stochastics
- Volume
- Triangles
- Futures
- Cycles
- Volatility
- ZIGZAG
- MESA
- Retracement
- Aroon
INDICATORS LIST
LIST OF TOPICS
PRINT THIS ARTICLE
by Donald W. Pendergast, Jr.
Here's a walk-forward followup on a long-only stock trading system that was featured in the January 2011 issue of STOCKS & COMMODITIES.
Position: N/A
Donald W. Pendergast, Jr.
Freelance financial markets writer and online publisher of the Trendzetterz.com S&P 500 Weekly Forecast service.
PRINT THIS ARTICLE
TRADING SYSTEMS
System Report Card For Walk-Forward Evaluation
10/04/12 08:18:12 AMby Donald W. Pendergast, Jr.
Here's a walk-forward followup on a long-only stock trading system that was featured in the January 2011 issue of STOCKS & COMMODITIES.
Position: N/A
| It's always a good idea to do followup work on a system to see how it has performed in the weeks, months, and years since it was originally developed. The MFI 5-5 system was originally tested on more than nine years of historical data (January 4, 2001, to July 29, 2010) and passed a very tough Monte Carlo trade simulation test with flying colors (with a 100% probability of profit on each Monte Carlo simulation) in a variety of portfolio configurations (Figure 1). You can find the exact system code and list of stocks in the original January 2011 STOCKS & COMMODITIES article. So let's look at the performance quality of the same system with the same stocks between July 30, 2010 and September 20, 2012. Is this system still pulling its weight? |

|
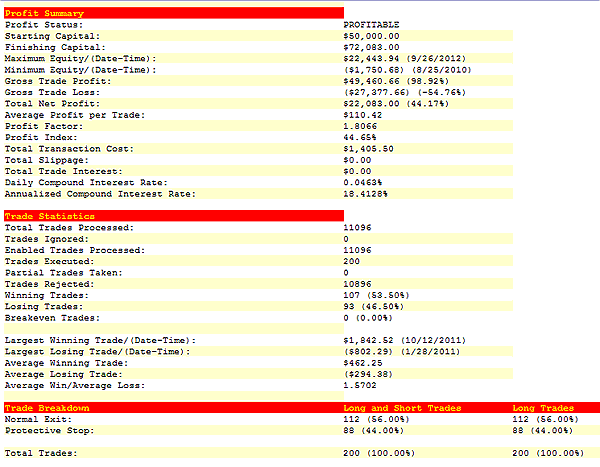
| FIGURE 1: MONTE CARLO SIMULATION RUN. A randomly selected Monte Carlo simulation run (one of 100,000) of the MFI 5-5 system produced positive, profitable results when traded on a diverse mix of 100 US large-cap stocks between late July 2010 and late September 2012. |
| Graphic provided by: Compuvision's TradeSim Enterprise. |
| |
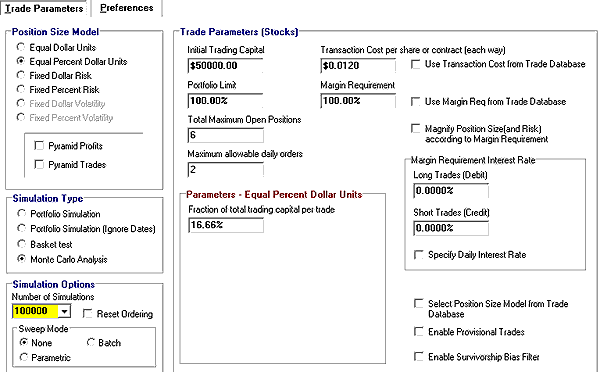
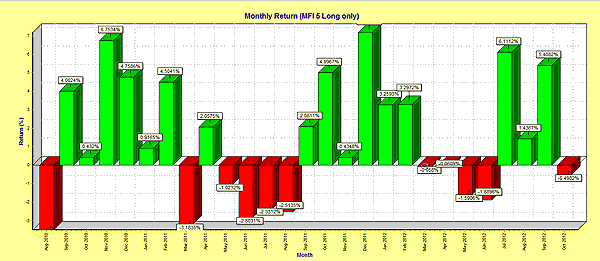
| In the original article (entitled "Making a Good System Great") extensive Monte Carlo simulation tests proved that trading a diversified mix of 100 US large-cap stocks that have been continuously traded since January 1, 2001, in a six-stock portfolio in which a maximum of two new long entries are taken on a given trading day produced the best risk-adjusted returns of all portfolio configurations tested. This walk-forward test uses the same stocks and portfolio size/new trade addition configuration and was tested on nearly 26 months of daily data beginning on July 30, 2010. See Figure 2. The starting account balance for the walk-forward test was $50,000, a 5% fixed stop-loss was used on every trade and commissions/slippage was calculated at $0.012 per share, with a minimum commission of $1.00 per side. The walk-forward results of a randomly selected Monte Carlo run are very good, if not picture perfect; the equity curve had a heavy drawdown between April 2011 and August 2011 but recovered nicely and has been in a 13-month long uptrend since then. System performance stats are also in line with (or even better in some cases) those of the original backtest, with a profit factor of 1.80, a winning percentage of nearly 54%, an average win/loss ratio of 1.57, and a maximum closed trade drawdown percentage of 11.18%. There were also 14 consecutive winning trades and 20 consecutive losing trades in the run. The annualized compound rate of return is a healthy 18.14%, far beyond the rate that a commercial bank offers. Finally, note the monthly return histogram bars. One look and you realize that it's a winning system, the deep drawdown in mid-2011 notwithstanding. |

|
| FIGURE 2: PARAMETER SETTINGS. The basic portfolio parameter settings used for the 100,000 Monte Carlo simulation runs in the MFI 5-5 system. |
| Graphic provided by: Compuvision's TradeSim Enterprise. |
| |
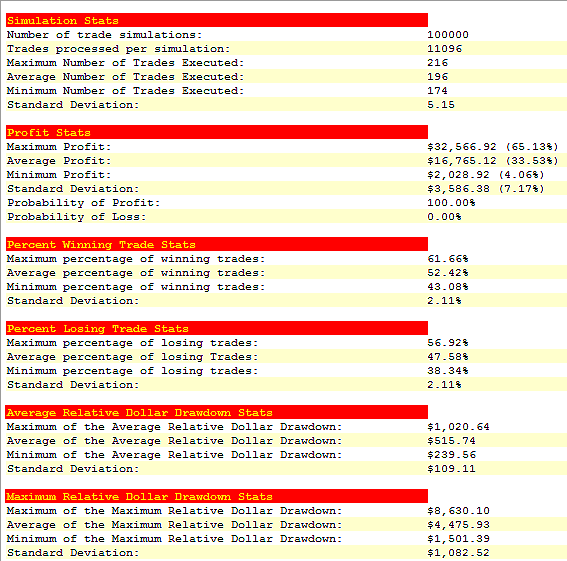
| The 100,000 Monte Carlo simulation run reveals that the MFI 5-5 system had a 100% probability of profit over the 26-month walk-forward period, with a relatively small standard deviation around the average profit figure of $16,765. What this means is that 68% of the runs were within the profit range of $13,179 to $20,251; 95% of the runs produced profits in the range of $9,593 to $23,937. Clearly, the MFI 5-5 system has proven itself to be a survivor in a variety of market conditions and looks to be a sound choice for swing traders looking to utilize a simple and straightforward mechanical trading strategy, without the need to make discretionary judgment calls along the way. The fact that it completely sidesteps the shorting of stocks should make it that much easier to trade and stay with for a long time. See Figures 3 and 4. |

|
| FIGURE 3: KEY TRADE STATS. The key trade stats produced by that 100,000-run Monte Carlo simulation. |
| Graphic provided by: Compuvision's TradeSim Enterprise. |
| |

|
| FIGURE 4: MONTHLY RETURNS. The monthly walk-forward returns of the MFI 5-5 system since July 30, 2010. |
| Graphic provided by: Compuvision's TradeSim Enterprise. |
| |
Freelance financial markets writer and online publisher of the Trendzetterz.com S&P 500 Weekly Forecast service.
| Title: | Market consultant and writer |
| Company: | Trendzetterz |
| Address: | 81 Hickory Hollow Drive |
| Crossville, TN 38555 | |
| Phone # for sales: | 904-303-4814 |
| Website: | trendzetterz.com |
| E-mail address: | support@trendzetterz.com |
Traders' Resource Links | |
| Trendzetterz has not added any product or service information to TRADERS' RESOURCE. | |
Click here for more information about our publications!
PRINT THIS ARTICLE

Request Information From Our Sponsors
- VectorVest, Inc.
- Executive Premier Workshop
- One-Day Options Course
- OptionsPro
- Retirement Income Workshop
- Sure-Fire Trading Systems (VectorVest, Inc.)
- Trading as a Business Workshop
- VectorVest 7 EOD
- VectorVest 7 RealTime/IntraDay
- VectorVest AutoTester
- VectorVest Educational Services
- VectorVest OnLine
- VectorVest Options Analyzer
- VectorVest ProGraphics v6.0
- VectorVest ProTrader 7
- VectorVest RealTime Derby Tool
- VectorVest Simulator
- VectorVest Variator
- VectorVest Watchdog
- StockCharts.com, Inc.
- Candle Patterns
- Candlestick Charting Explained
- Intermarket Technical Analysis
- John Murphy on Chart Analysis
- John Murphy's Chart Pattern Recognition
- John Murphy's Market Message
- MurphyExplainsMarketAnalysis-Intermarket Analysis
- MurphyExplainsMarketAnalysis-Visual Analysis
- StockCharts.com
- Technical Analysis of the Financial Markets
- The Visual Investor
