HOT TOPICS LIST
- MACD
- Fibonacci
- RSI
- Gann
- ADXR
- Stochastics
- Volume
- Triangles
- Futures
- Cycles
- Volatility
- ZIGZAG
- MESA
- Retracement
- Aroon
INDICATORS LIST
LIST OF TOPICS
PRINT THIS ARTICLE
by Donald W. Pendergast, Jr.
Shares of Accenture roared higher late last week, gapping higher on wide range and big volume; technicals warn the move could be short-lived, however.
Position: N/A
Donald W. Pendergast, Jr.
Freelance financial markets writer and online publisher of the Trendzetterz.com S&P 500 Weekly Forecast service.
PRINT THIS ARTICLE
BREAKOUTS
Accenture Price/Volume Breakout
10/03/12 08:25:34 AMby Donald W. Pendergast, Jr.
Shares of Accenture roared higher late last week, gapping higher on wide range and big volume; technicals warn the move could be short-lived, however.
Position: N/A
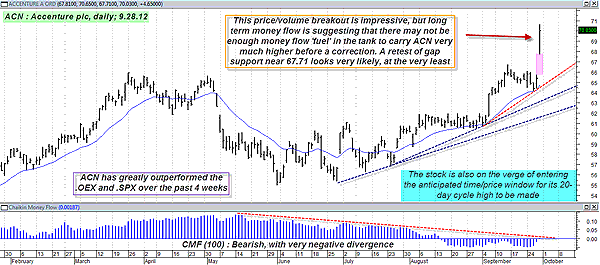
| Since making a multicycle low on June 1, 2012, shares of Accenture (ACN) have managed to post 28% in gains. The rise higher has had numerous false starts and retests of support and pullbacks along the way, making it a rough ride for buy & hold types. A nice surprise recently for ACN bulls was the powerful price/volume breakout on Friday, September 28, 2012, that caused the stock to jump by 7.1% (close-to-close basis) on above-average 50-day volume. Two key technicals are now suggesting that ACN's latest surge may actually have moved the stock closer to the end of its entire four-month-old rally rather than being the start of a significant bullish swing move. Here's a closer look now. |

|
| FIGURE 1: ACN, DAILY. With such bearish price/money flow divergences in place, the fact that ACN is also due to make a nominal 20-day cycle high sometime during the next three weeks should be sufficient warning that a multicycle high and/or trend reversal may appear soon in this stock. |
| Graphic provided by: MetaStock. |
| |
| Sometimes, it's easier to discern the probabilities of a stock heading in a certain direction over the near term than at others. This is a time when it looks like ACN is extremely likely to peak very soon before pulling back and correcting, if not actually staging a major trend reversal. Based on the incredibly bullish-looking price action on ACN's daily chart (Figure 1), that statement sounds ridiculous, but when you start evaluating the stock's long-term money flow and nearer-term price cycle projections, things don't look quite as rosy for the prospect of sustained gains for this issue anytime soon. ACN's 100-day Chaikin money flow (CMF)(100) is manifesting an unbelievably bearish price/money flow divergence, one that's been under way for nearly 16 weeks now. The money flow histogram is also well below its zero line, and this does not bode well for those who may be banking on yet another trend thrust higher for ACN heading into October 2012. Price/money flow and price/momentum divergences are excellent technical tools that can help better time upcoming cycle highs/lows and trend reversals in almost any liquid market, especially when used in conjunction with price cycle studies. See Figure 2. |

|
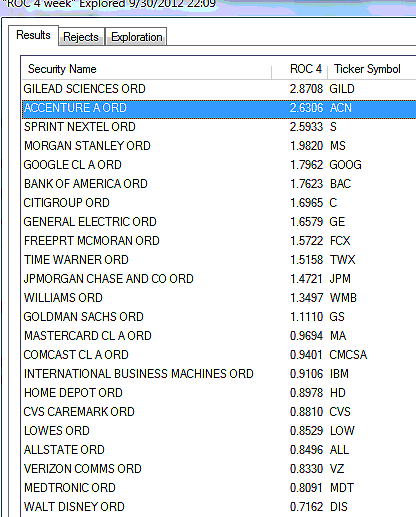
| FIGURE 2: LARGE CAPS. Here are the large-cap stocks that are outperforming the .OEX over the past four weeks. |
| Graphic provided by: MetaStock. |
| Graphic provided by: MetaStock Explorer. |
| |
| ACN's nominal 20-day cycle (actual length is 24 calendar days) is due to peak between the dates of October 1 and October 22, 2012, with a maximum target price of 74.64. That target is $4.61 higher than Friday's breakout close, so while there might be a bit of room for ACN to run higher during the next three weeks, it is almost a certainty that the stock will pull back (possibly to the upper boundary of the pink open gap zone near 65.71). Again, the horrifically bearish long-term money flow readings would almost seem to make this a near 100% probability event, so be very careful if attempting to go long this breakout right now -- by all means, either wait for a pullback to jump in or perhaps just consider standing aside and waiting for a less explosive setup to appear. Put buyers might want to watch the price action in ACN should it pull back to the red uptrend line; a minor bounce higher followed by a failed retest could really lead to some further declines. The lower two trendlines might be useful as short-term price targets for long speculative put positions. Risk 2% or less of your account value and close any long put option that either doubles in price or declines by half of its initial value, no matter how this hypothetical setup actually plays out. |
Freelance financial markets writer and online publisher of the Trendzetterz.com S&P 500 Weekly Forecast service.
| Title: | Market consultant and writer |
| Company: | Trendzetterz |
| Address: | 81 Hickory Hollow Drive |
| Crossville, TN 38555 | |
| Phone # for sales: | 904-303-4814 |
| Website: | trendzetterz.com |
| E-mail address: | support@trendzetterz.com |
Traders' Resource Links | |
| Trendzetterz has not added any product or service information to TRADERS' RESOURCE. | |
Click here for more information about our publications!
PRINT THIS ARTICLE

Request Information From Our Sponsors
- StockCharts.com, Inc.
- Candle Patterns
- Candlestick Charting Explained
- Intermarket Technical Analysis
- John Murphy on Chart Analysis
- John Murphy's Chart Pattern Recognition
- John Murphy's Market Message
- MurphyExplainsMarketAnalysis-Intermarket Analysis
- MurphyExplainsMarketAnalysis-Visual Analysis
- StockCharts.com
- Technical Analysis of the Financial Markets
- The Visual Investor
- VectorVest, Inc.
- Executive Premier Workshop
- One-Day Options Course
- OptionsPro
- Retirement Income Workshop
- Sure-Fire Trading Systems (VectorVest, Inc.)
- Trading as a Business Workshop
- VectorVest 7 EOD
- VectorVest 7 RealTime/IntraDay
- VectorVest AutoTester
- VectorVest Educational Services
- VectorVest OnLine
- VectorVest Options Analyzer
- VectorVest ProGraphics v6.0
- VectorVest ProTrader 7
- VectorVest RealTime Derby Tool
- VectorVest Simulator
- VectorVest Variator
- VectorVest Watchdog
