HOT TOPICS LIST
- MACD
- Fibonacci
- RSI
- Gann
- ADXR
- Stochastics
- Volume
- Triangles
- Futures
- Cycles
- Volatility
- ZIGZAG
- MESA
- Retracement
- Aroon
INDICATORS LIST
LIST OF TOPICS
PRINT THIS ARTICLE
by Gary Grosschadl
The main indices are coming due for a rally. Here is a prudent strategy for traders taking their cue via technical analysis.
Position: N/A
Gary Grosschadl
Independent Canadian equities trader and technical analyst based in Peterborough
Ontario, Canada.
PRINT THIS ARTICLE
CHART ANALYSIS
Smart Trader's Guide For The Next Nasdaq/DOW Rally
07/12/02 10:29:02 AMby Gary Grosschadl
The main indices are coming due for a rally. Here is a prudent strategy for traders taking their cue via technical analysis.
Position: N/A
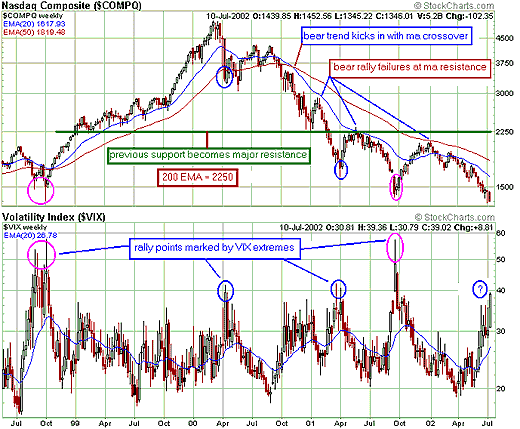
| There is a lot of talk now about capitulation on one side and further deterioration on the other. Using VIX extremes and moving average resistance you can devise a simple market strategy, in this case based on the weekly Nasdaq chart. It can be applied to most major western indices as they are all mimicking the US's. |
| In previous VIX articles I have explained this undisputable linkage to the main indices, especially the Nasdaq. The Chicago Board Options Exchange Volatility Index is used by stock and options traders to monitor the market's anxiety level. I won't get into the math, but suffice to say for contrarians, low readings for the VIX are bearish, while high readings are bullish. The chart below clearly shows how VIX extreme readings are a precursor to rallies. By this measure we are at extreme levels now as today's intraday action already has VIX exceeding 40. |

|
| Graphic provided by: stockcharts.com. |
| |
| Using VIX extremes and moving averages as a guide, there is no doubt that a rally is coming for the main indices. It will be a matter when it begins and to what degree as we are still in a bear trend till proven otherwise by future market confirmations. You do not have to try to catch the precise bottom as no one is interested in trying to catch a falling knife either. To avoid this we simply wait for the first bullish candle up-day and then let the rally play itself out, even if it is just another bear rally. Here are the targets based on moving average resistance. 1. Small rally target - is 20-day EMA resistance --1615-1620 2. Large rally target - is 50-day EMA resistance -- 1800-1820 3. Monster rally target - is our old friend 200-day EMA -- 2250 |
| Should we surpass the 50-day EMA, the coast looks relatively clear for a bullish trend change. Should we fail before the 50-day EMA, then expect this to be yet another bear rally and anticipate a final downward thrust to challenge DOW 8000 and NAS 1000-1100. Readers may want to review an earlier article titled "The Dow's Bearish Broadening Formations Persist" to see where these targets come from. |
| With extreme bullishness, note the all important 200-day EMA at 2250. Expect major resistance once it finally gets there. This area may be tested several times before it becomes future support in the next genuine bull phase. |
Independent Canadian equities trader and technical analyst based in Peterborough
Ontario, Canada.
| Website: | www.whatsonsale.ca/financial.html |
| E-mail address: | gwg7@sympatico.ca |
Click here for more information about our publications!
Comments
Date: 07/13/02Rank: Comment: Sir i want to know that at the current level of pessimisim market is in to whcih phase. whether nasdaq has completed its 5 the downward waveor not.
Date: 07/15/02Rank: 5Comment: ~Good insight
Date: 07/15/02Rank: 5Comment:
Date: 07/16/02Rank: 5Comment:
Date: 07/22/02Rank: 5Comment:
Date: 07/25/02Rank: 5Comment:

Request Information From Our Sponsors
- StockCharts.com, Inc.
- Candle Patterns
- Candlestick Charting Explained
- Intermarket Technical Analysis
- John Murphy on Chart Analysis
- John Murphy's Chart Pattern Recognition
- John Murphy's Market Message
- MurphyExplainsMarketAnalysis-Intermarket Analysis
- MurphyExplainsMarketAnalysis-Visual Analysis
- StockCharts.com
- Technical Analysis of the Financial Markets
- The Visual Investor
- VectorVest, Inc.
- Executive Premier Workshop
- One-Day Options Course
- OptionsPro
- Retirement Income Workshop
- Sure-Fire Trading Systems (VectorVest, Inc.)
- Trading as a Business Workshop
- VectorVest 7 EOD
- VectorVest 7 RealTime/IntraDay
- VectorVest AutoTester
- VectorVest Educational Services
- VectorVest OnLine
- VectorVest Options Analyzer
- VectorVest ProGraphics v6.0
- VectorVest ProTrader 7
- VectorVest RealTime Derby Tool
- VectorVest Simulator
- VectorVest Variator
- VectorVest Watchdog
